Figure 11.22

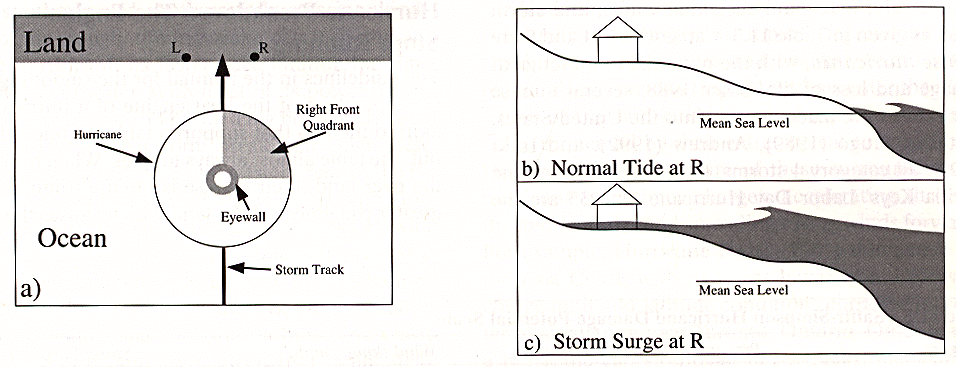
Figure 11.22. The impact of the storm surge along the
coast. (a) As a hurricane approaches the coastline, the right
front quadrant is the area with greatest storm surge potential. To
the left of the location of landfall (represented by position L),
the magnitude of the storm surge is often reduced, sometimes below
mean sea level; (b) Normal tides at position R; (c) During
landfall, position R to the right of the location of landfall is
inundated with a storm surge, driven by the onshore winds and
forward motion of the hurricane.

