Jonathan P. Mathews Ph.D.
Coal Scientist and Associate Professor in the Leone Family Department of Energy and Mineral Engineering
126 Hosler Building, University Park, PA 16802, USA
jmathews@psu.edu (814) 863 6213
In-House Software
Recognizing that the commercial codes were limited in the creation and use of large-scale atomistic representations, we have written a variety of unique image-analysis software and construction tools to aid in the creation of atomistic models that capture the structural diversity and partial ordering that is required to capture coal and char behavior. Large-scale structures are required to permit the inclusion of structural diversity and an appropriate pore size distrbuion. The scale has also required novel visualization, analysis, and simulation capabilities. Mostly they are stand alone Perl or MATLAB scripts. Some scripts however run within the Materials Studio platform for analysis and model manipulation.
Image Processing Automation
To ensure consistency and ease-of-use for conversion of HRTEM micrographs to the lattice fringe micrographs we use a combination of comercial codes including Photoshop with the Fovea Pro plugin. Automation is used to progress throught the processing sequence with stops when user input/selections are required. It typically takes ~3 minutes to process each HRTEM micrograph and perform a basic image analysis.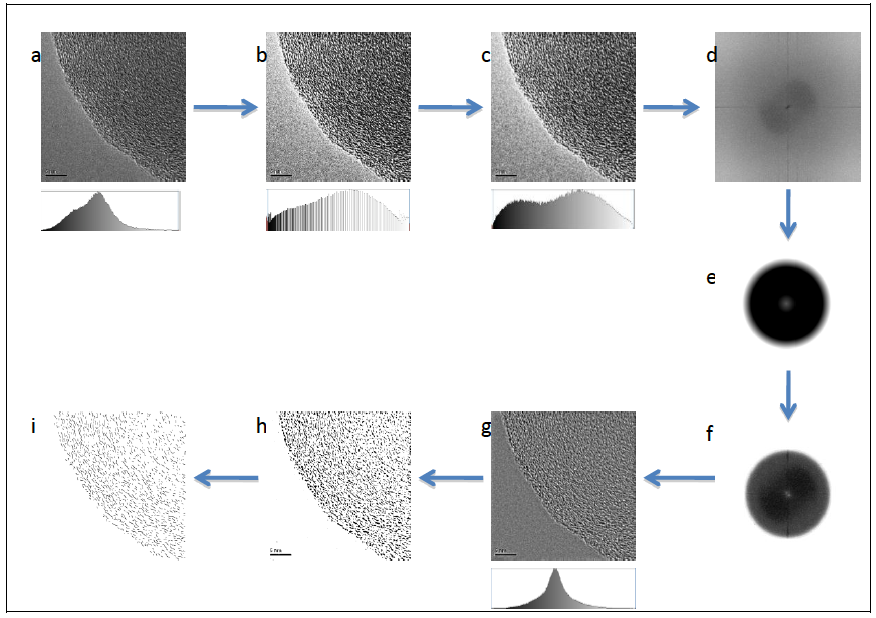
Publications:
Fringe3D
Once lattice fringe micrographs were available it was evident that they contained a great deal of structural information that could inform structural modeling efforts (atomistic representations). Manual attempts to capture the structural nuances were impractical given the ~500 fringes in each micrograph and the distributions: of fringe length, orientation, stacking, spacing, etc. Thus the code Fringe3D was created in collaboration with Dr. Justin Watson. Image analysis is used to identify the fringes, the relative location of each fringe centroid, length, and angle. From these data (and assumptions) the size/identification of the polyaromatic hydrocarbons comprising each fringe is predicted. From calibration molecules the software sends the appropriately sized molecule to the appropriate location and pitches the structure to the appropriate angle. It may also be rotated around the perpendicular axis to obtain edge orientation diversity. The calibration molecule (a graphene sheet with a particular catenation) sits with a centroid at 0, 0, 0 Cartesian coordinates utilizing an atom numbering scheme such that additional atoms add another hexagonal ring to the PAH molecule. In this manner the construction of the aromatic “slice” model is image-guided and avoids energetic considerations — creating what is observed rather than idealized or assumed associations. Thus due to the approach the construction is immediate/rapid and is typically only a few seconds to create a slice model of ~40,000 aromatic atoms. The term slice model is used to indicate that in duplicating the HRTEM the structure has limited depth. We also assume the fringe is as deep as it is wide and send linear molecules although we are currently working on curvature inclusion. Scripts are used to create cross-links constrained by molecular weight distributions, add heteroatom functionality, etc.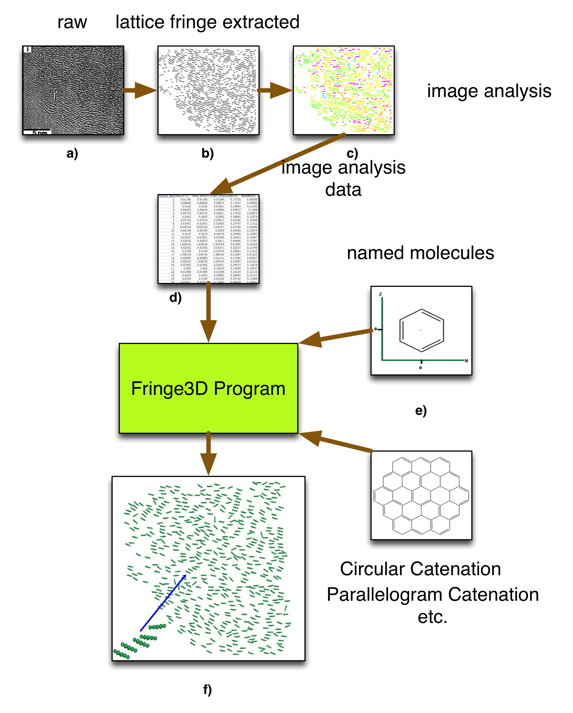
Publications:
Advanced Image Analysis (Stacking, d-Spacing, and Curvature)
Stacking and d-spacing
From HRTEM lattice fringe micrographs the ordering and stacking of the PAH molecules is evident. To allow the capturing of this stacking in volumetric reconstructions a MathLab code was created (Enette Louw) that used the basic image analysis data (centroid location, length, and angle) to identify stacking from a lattice fringe micrograph. The user can select maximum d-spacing, centroid spacing, and angle differences. These stacks are quantified and their distribution can be created by Fringe3D (each stack is a file with the centroid being at the 0, 0, 0 Cartesian location). The d-spacing data is also captured.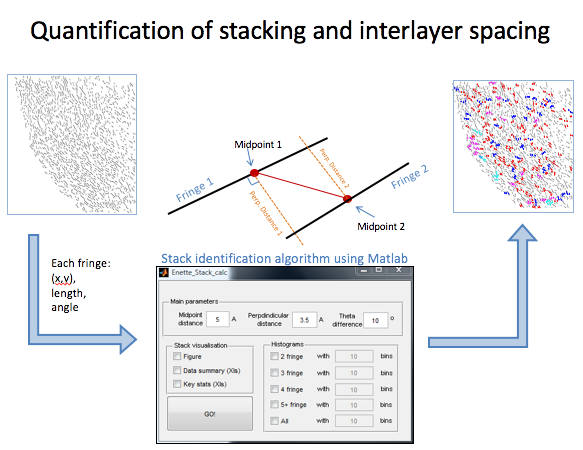
Publications:
Curvature
Considerable curvature is evident from the HRTEM lattice fringe micrographs. For some samples these include undulating lines that are poorly captured by the use of tortuosity. The change in angles along the fringe may also relate to structural features so greater depth of analysis was required. In collaboration with Drs. Thomas Huddle and Ed Lester of Nottingham University a curvature analysis code was created. This identifies segment frequency, segment lengths, angles between segments, frequency of inflection points, relative locations, and overall angle changes. For consistency and comparison with the bulk of the literature, tortuosity is also determined. Thus an improved analysis for lattice fringes: coal, char, and soots; or simply line analyses is available.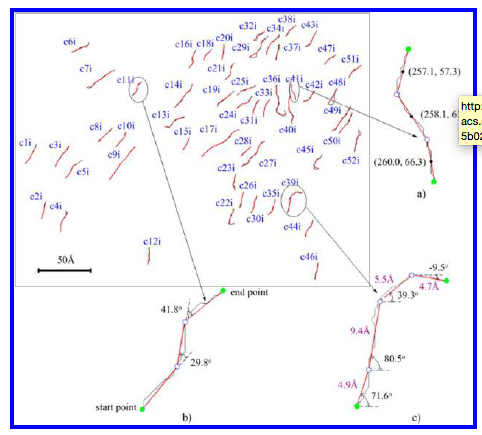
Publications
Vol3D
To overcome the limitations with slice models a volumetric construction strategy was needed. Unfortunately, existing software did not constrain the components such that the local ordering was preserved. Thus Vol3D was created in collaboration with Dr. Justin Watson. The user defines the distribution of molecules, stacks, and pores using Fringe3D, they define the volume (x, y, z) of a box. The components are treated as volume elements and added to the box such that overlap is not permitted (volume exclusion). Inherent porosity is created due to the stacking and placement of the volume elements. Once this quantity is determined additional porosity can be included in the distribution and the pore size distribution captured. Again as the placement is simply volume elements the construction is rapid taking minutes for a 50,000 atom model.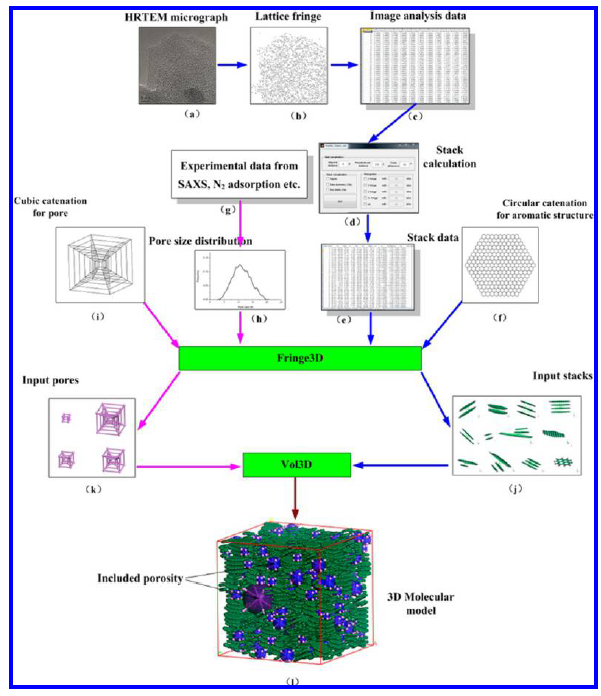
Publications:
Combustion / Oxy-Fuel Combustion / Gasification Reactivity Simulations
Using Vol3D we are able to capture the char structure with ease. However, there are challenges in examining the char reactivity by traditional approached due to the large-scale required by the structural diversity and pore size distribution. Thus, we created a simplistic simulation within Materials Studio with scripts running the sequential process and aiding in capturing the structural transformations. The steps include:- Place char into a periodic boundary box surrounded by oxygen (or reactive molecule)
- Allow reactive gas to diffuse via molecular dynamics (char remains fixed)
- For the reactive gas molecules that are within the specified distance of a reactive carbon: delete the carbon but retain the reactive gas molecule
- Repeat the sequence but with an additional clean-up of ring fragments
- Number of reactive and reacting atoms (the rate)
- Where the atoms are being deleted
- The size of the char
- Via PoreBlazer the density, pore location, and pore size distribution
Publications:
Automation of Construction and Evaluation via Scripts (Within Materials Studio)
We use the tools Fringe3D etc. to create basic aromatic structures (or we could use name molecules also). These we can change into the appropriate molecules (addition of heteroatoms in the correct functionality) etc. as well as change the molecular weight distribution via cross-linking etc. Thus our strategy is to build to suit rather than go through a multi-step evaluation process (this is thus much quicker). We perform structural evaluations in the same way and can control the distributions by manipulating the structures within select ranges. Examples include:Construction
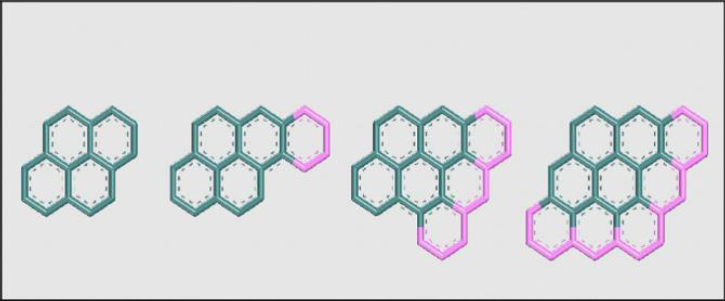
Example of ring additon in Fringe3D
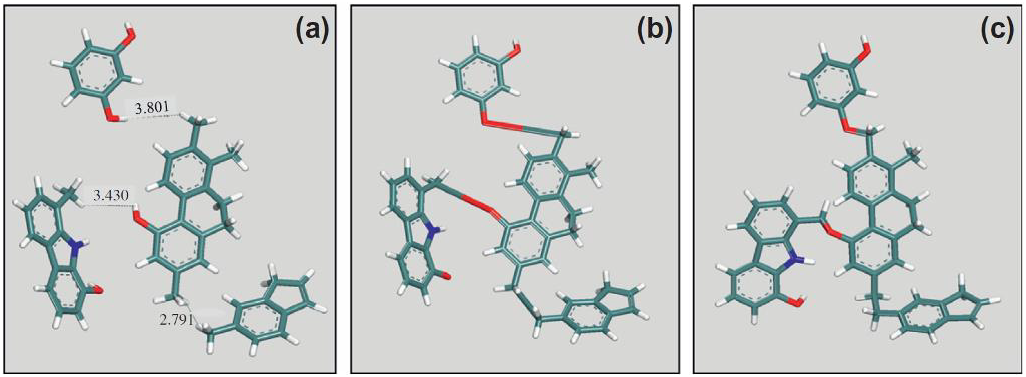
Cross-linking example
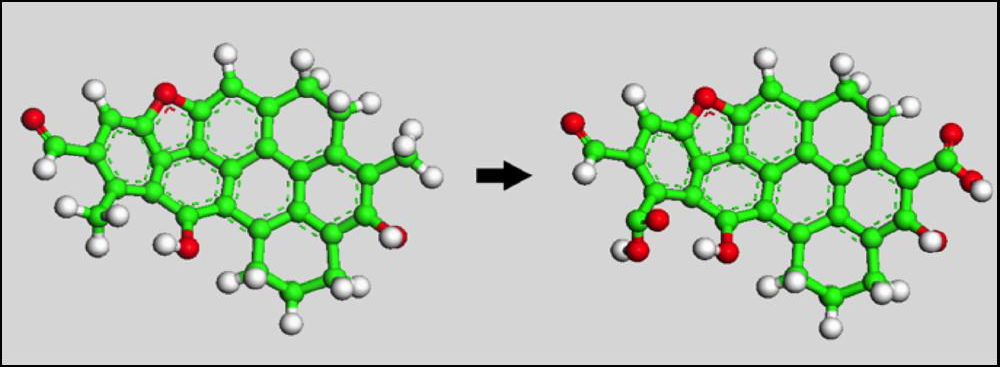
Oxydation example
Cleave cross-links (aliphatic) example
Evaluation
Publications:
Visualization
Because our structures are so large we often need visualization aids to help view and identify structural features and their transformations.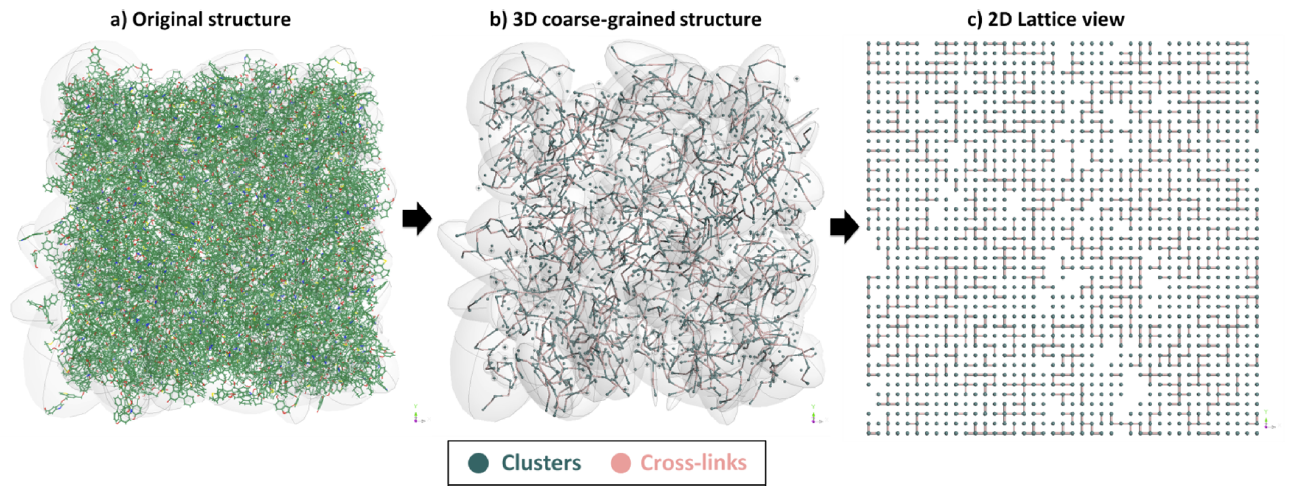
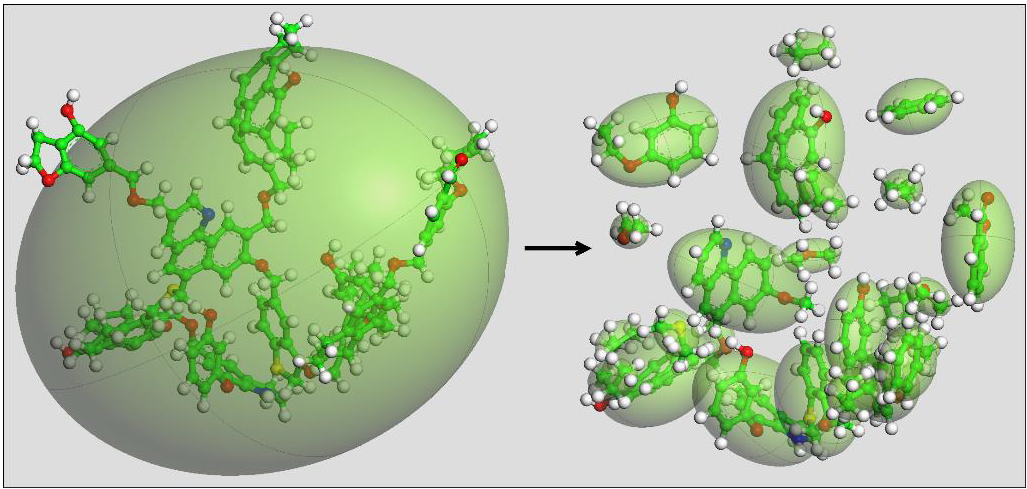
3D to 2D Lattice
Using COAL2D ring centroids are mapped and cross-liks identified for use in visualization of structure and data
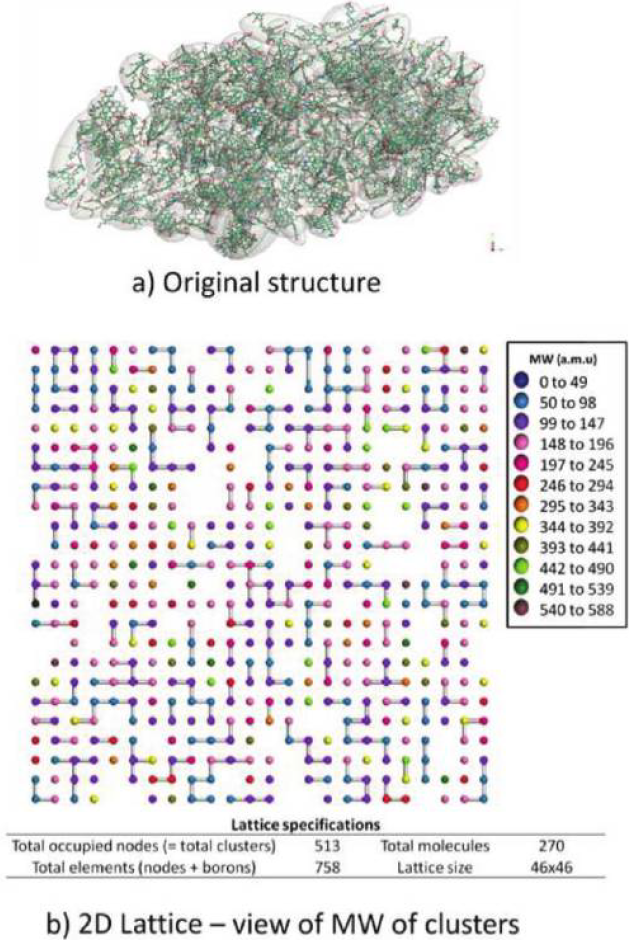
Molecular Weight and Cross-Linking
Another coal structure example
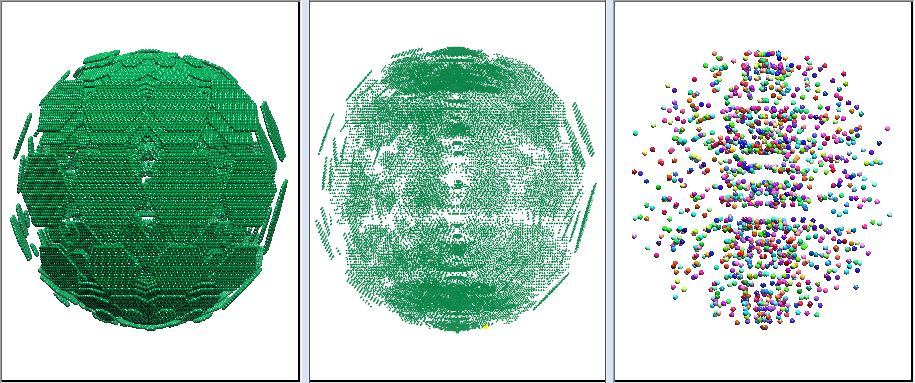
Soot to Centroid progression
COAL2D allows for ring statistices as well as the simplification of complex models
Publications: