Chapter 7. Stratospheric Chemistry.
Stratospheric
chemistry became environmental chemistry in the early 1970’s when scientists
studied the potential stratospheric effects of supersonic aircraft (Crutzen,
1970; Johnston, 1971). They realized
that human activity could affect the chemistry of this cold, remote region 10
to 40 km above the Earth. Of greatest
concern was the destruction of stratospheric ozone, Earth’s protective shield
against solar ultraviolet light. This
concern sparked a flury of activity that in 1987 led to an international
treaty, the Montreal Protocol, for controlling the production and use of
man-made chlorofluorcarbons (CFCs) that affect stratospheric ozone.
Studies of
stratospheric chemistry began when Hartley (1881) first proposed ozone's
presence in the upper atmosphere. A
description of ozone chemistry came later when Chapman proposed the reaction
sequence, now called the Chapman mechanism (Chapman, 1930):
|
O2 + hn (l < 242
nm) ® O + O (1) O + O2 + M (M = N2, O2) ® O3 + M (2) O3
+ hn ® O + O2 (3) O +
O3 ® O2 + O2 (4) |
The results from this simple model were later found to differ from the observed ozone in two ways. First, the calculated average total ozone column is more than twice as large as measured (Brewer and Wilson, 1968). The total ozone column is the amount of ozone per unit area of the Earth's surface integrated radially from the surface to space. This difference indicates a problem with the chemistry. Second, the model predicts that ozone concentrations should be largest in the tropics, where the ozone production is greatest whereas observations have shown that the ozone amount is greatest at high latitudes (Duetsch, 1968). This second difference indicates a problem with ozone transport.
A way to resolve
the problem of excess calculated ozone was found in the 1950’s, when Hampson
(1965) and Bates and Nicolet (1950) proposed that the reactive hydrogen
species, hydroxyl (OH) and hydroperoxyl (HO2), form a cycle that
catalytically destroys ozone. A second
cycle involving the reactive nitrogen species, nitrogen dioxide (NO2)
and nitric oxide (NO), was proposed two decades later (Hampson, 1966; Crutzen,
1970; Johnston, 1971). A few years
later, cycles involving reactive chlorine (Stolarski and Cicerone, 1974;
Rowland and Molina, 1974) and bromine (Wofsy et al., 1975) were proposed. Several other cycles have been found as
laboratory studies and atmospheric measurements have uncovered new reactions
and chemistry. Adding this chemistry to
the Chapman mechanism has greatly improved the agreement between the calculated
and observed ozone concentrations.
The differences
between the modeled and observed ozone distribution were largely resolved by
considering stratospheric transport.
Brewer (1949) suggested that the dryness of the stratosphere resulted
from air entering the stratosphere in the tropics. Only in the tropics are the temperatures at
the tropopause low enough to “freeze-dry” the air to its observed dryness as it
enters the stratosphere. Dobson (1956)
argued that air entering the stratosphere in the tropics and moving toward high
latitudes would create the observed high ozone concentrations there. Once at high latitudes, this air descends
back into the troposphere, completing the cycle.
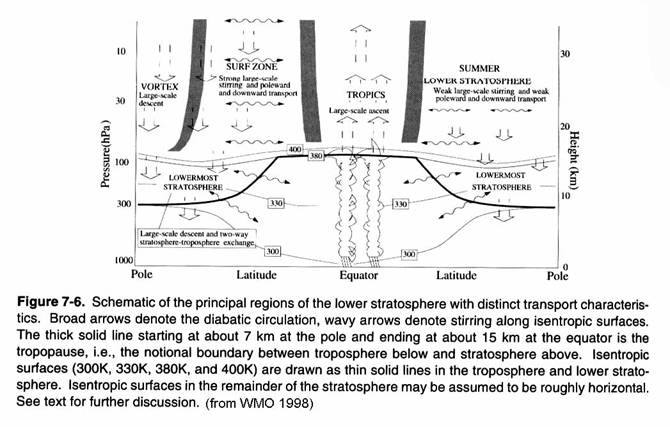
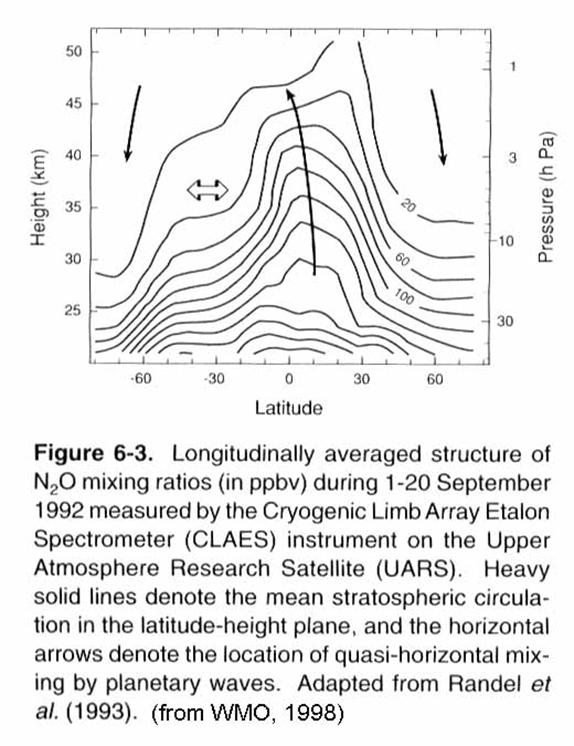
The current view of
stratospheric transport is found in the following figure. Note the more rapid descent in the winter
hemisphere compared to the summer hemisphere.
In fact, mass of air that
descends back into the troposphere is almost twice as large in the Northern
Hemisphere as it is in the Southern Hemisphere.
Note too the weak exchange between the stratosphere and troposphere in
the lowermost stratosphere. The gray
shaded areas are quasi-barriers to transport between the tropics and the
midlatitudes and the winter hemisphere surf zone and the winter vortex.
This general
picture of meridional transport from tropics to high latitudes does not describe
the actual paths taken by molecules entering the stratosphere. These paths involve rapid circulation around
the globe (weeks), rising in the tropics (months), and transport downward
toward the poles (months - years).
Parcels of air do not stay intact long, but rather, are mixed with other
air parcels by eddies, and lose their identity in a week or so. This mixing occurs on quasi-horizontal
surfaces that slope toward the poles.
The mixing is quasi-horizontal because horizontal transport is much
faster than vertical transport. The
surfaces slope toward the poles because forces caused by atmospheric waves act
as a suction pump that pulls air upward and poleward from the tropics and
pushes air downward at middle-to-high latitudes (Holton et alo., 1995). This quasi-horizontal mixing is rapid in the
middle latitudes (McIntyre and Palmer, 1983; Plumb and Ko, 1992), but mixing
with the tropics and the wintertime polar region is impeded (McIntyre, 1989). The transport of air into, through, and out
of the stratosphere has a profound influence on the chemistry.
Depending on the
exact path taken by a molecule, it can stay in the stratosphere from a few
years (taking a path just above the tropopause) or as many as 6-7 years (taking
a path through the mesosphere). A
typical value is closer to 3 to 4 years.
We can see rate of transport up into the tropical stratosphere by
looking at the vertical variation of seasonally varying gases, such as CO2
and H2O. For the rest of the
stratosphere, we can find the average lifetime
A whole new
dimension was added to studies of stratospheric chemistry in 1985, when
observations of rapid springtime ozone loss over Antarctica were first reported
by members of the British Antarctic Survey (Farman et al., 1985). Quick analyses showed that the known chemical
cycles could not be responsible. New
chemical mechanisms were proposed that involved chlorine chemistry (Solomon et
al, 1986; McElroy et al., 1986; Molina
and Molina, 1987). Most surprising was
the discovery that stratospheric particles composed of water vapor and nitric
acid, called polar stratospheric clouds (PSCs), act as sites to produce this
halogen-dominated chemistry (Toon et al., 1986; Tolbert et al., 1987; Leu,
1988; Molina et al., 1987). The reactions of gases on particles, called
heterogeneous chemistry, are now known to be important not just for the polar
regions but also for the entire lower stratosphere.
The focus of much
of the research in stratospheric chemistry over the last fifty years has been
on ozone and the possibility of human influences on it. In this chapter, we give a primer to
stratospheric ozone chemistry. First is
a description of stratospheric structure and ozone climatology. Second is a brief tutorial on chemical
concepts used frequently in atmospheric chemistry. Third is a description of stratospheric ozone
chemistry in both the tropics and middle latitudes and in the wintertime polar
regions.
The Structure of
the Stratosphere
The stratosphere
extends from the tropopause, a temperature minimum near 15 km in the tropics
and 10 km at high latitudes, to the stratopause, a temperature maximum, at
about 50 km. Temperatures at the
tropopause are generally 190-215 K, while temperatures at the stratopause are 240-250
K. In the wintertime polar stratosphere,
temperatures can drop to 175-180 K.
Although stratospheric temperatures increase everywhere with height, the
temperature values depend upon the location and the season, particularly in the
lower stratosphere and upper stratosphere.
The average
vertical profile of pressure comes from the competition between gravity, which
pulls air toward Earth’s surface, and the molecular kinetic energy, which keeps
the molecules moving. Expressed
mathematically, this competition results in the Law of Atmospheres: p = psurfaceexp(-mgz/kT), where psurface
is the surface pressure, m is the molecular weight, g is the acceleration due
to gravity, z is the height, k is the Boltzmann constant, and T is the
temperature. On average, the factor,
kT/mg, which is called the scale height H, is 7 ± 1 km. Thus, the
atmospheric pressure falls off exponentially with height by a factor of e-1
(2.7) every 7 km. The resulting
stratospheric pressure ranges from 100 hPa at 15 km to 0.1 hPa at 50 km. The atmospheric number density (molecules
cm-3, or cm-3) is related to pressure and temperature by
the ideal gas law, n = P/kT. It varies
from 4x1018 cm-3 at 15 km to 3x1016 cm-3
near 50 km. Because the number density
affects individual reactions differently, the importance of individual
reactions changes from the lower to upper stratosphere.
Stratospheric
temperatures increase with height because stratospheric ozone and, to a lesser
extent, molecular oxygen absorb ultraviolet sunlight and convert some of the
energy into molecular kinetic energy, or heat.
The stratospheric temperature structure gives the stratosphere its
stability. To understand this stability,
consider a small parcel of air that is forced slightly upward but does not mix
with the surrounding air. As it rises,
the air in the parcel expands as its pressure decreases and, if no heat is
added, it cools. If after it has cooled
the air in the parcel is less dense then its surroundings, then it will
continue to rise. However, if the air
parcel is still more dense than the surrounding air, then it will sink back down to its original
position. The increasing temperature
with height insures that rising air parcels will be more dense that their
surroundings and will sink back down, thus creating the stability of the
stratosphere. Air does move higher in
the stratosphere, but must do so by absorbing energy from radiation or
atmospheric waves or by mixing with the air above it.
Ozone Climatology
and Observed Change
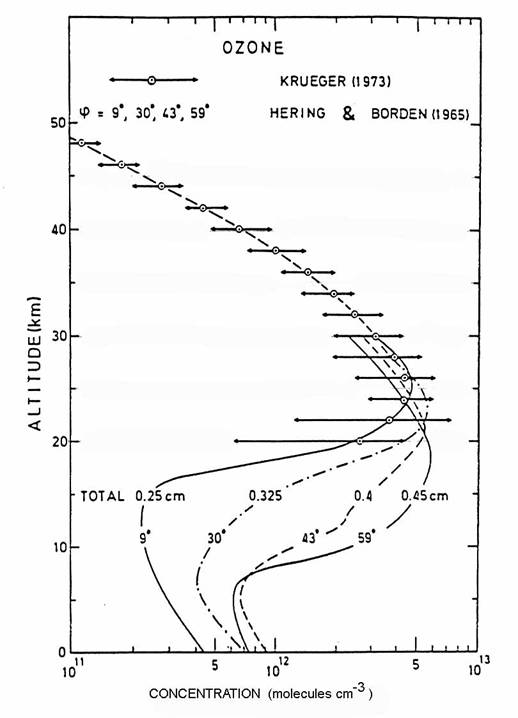
A combination of
production, loss, and transport produces the global distribution of ozone
volume mixing ratio as seen in the following figure. The vertical profile indicates
that the ozone peak is at 35 km in the tropics.
As air is transported away from the ozone production region in the
tropics to higher latitudes, ozone loss begins to dominate ozone
production. Outside of the tropics,
ozone follows mixing surfaces that tend to slope downward toward the poles. Because the concentration of air molecules (N2,
O2, and minor constituents) is greater at lower altitudes, the
downward slope of the mixing surfaces causes the ozone concentration to
increase toward the poles, even though the mixing ratio decreases
slightly. The total ozone column
abundance, which is the sum of all ozone molecules directly overhead, also
increases toward the poles as a result.
The observed total
ozone column abundance is largest in the springtime in both hemispheres. This maximum results from active descent of
stratospheric air, driven by propagation of eddies from vigorous springtime
weather in the troposphere. Because the
Northern Hemisphere has a more asymmetric distribution of land mass in the
polar region, eddies are more intense in the Northern Hemisphere: hence the
greater the downward pull and the greater the ozone column.
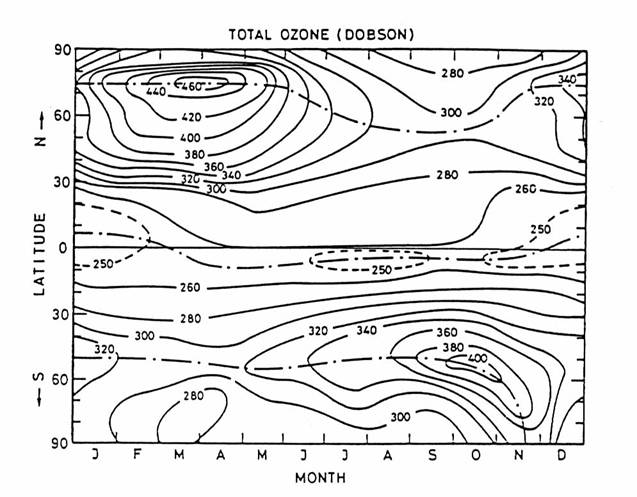
The observed total O3 column abundance as a function of
latitude and season. Total ozone column
abundance is defined as the vertical integral of ozone concentration from the
surface to space. 300 Dobson units (DU)
= 3 mm of pure O3 at 1013 hPa and 273 K. Observations are from the LIMS instrument on
Nimbus 6 from 1978-1979. (from London, 1980)
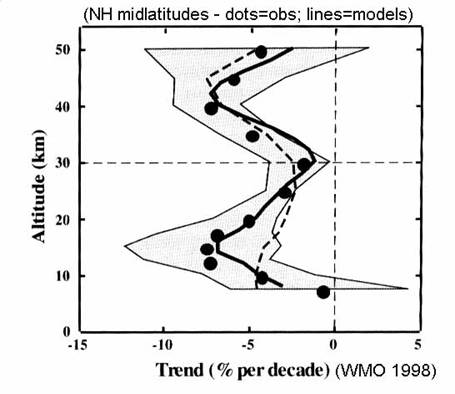
The abundance and
distribution ozone have changed during the last twenty years. This change is largest in the Southern
Hemisphere in austral spring, called the Antarctic ozone hole. However, the downward ozone trend persists
throughout the year at the middle and high latitudes, as in the next figure.
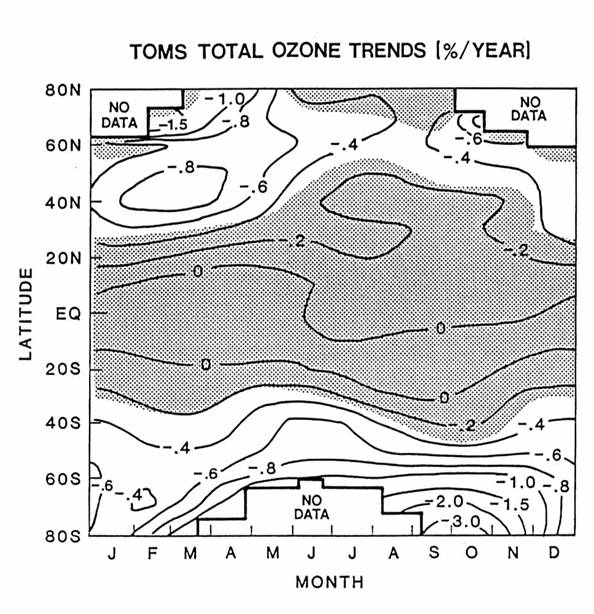
Ozone appears to
remain unchanged in the tropics. The
altitude of greatest change is in the lower stratosphere, below 20 km at both
middle latitudes and the polar regions.
These changes are linked to changes in trace gas concentrations and
chemistry.

Recall that the
Chapman mechanism is the series of 4 reactions:
O2 + hν ® 2 O J(O2) (1)
O + O2 + M ® O3 + M kM+O2+O (2)
O3 + hν ® O + O2 J(O3) (3)
O + O3 ® 2 O2 kO+O3 (4)
The lifetimes of O
and O3 are less than a hour because O and O3 are rapidly interchanged
by reactions 2 and 3. However, the
lifetime of the sum of O and O3, denoted Ox, is weeks to
years because reactions 1 and 4, the production and destruction of Ox,
take a week to months. Because the
amount of sunlight is roughly constant near midday, [O] and [O3],
the concentrations of O and O3, will become constant. From the rate equation for O3
comes the steady state relationship between O and O3:
![]()
This relationship
shows that O exists only during the day, where JO3 ¹ 0. Because the reaction rate kM+O2+O
[M][O2] >> JO3, [O] is 103 to 106 times less than [O3] in the
stratosphere.
A fourth useful
concept is catalytic cycles that destroy ozone.
The reaction of O with O3 (1-4) remakes the O2 chemical
bond that was broken by photolysis.
Some cycles also make the O2 chemical bond. Suppose species X that reacts rapidly with O3
and a species XO that reacts rapidly with O.
Then a catalytic cycle that destroys Ox is the two reactions:
X + O3
® XO + O2
XO
+ O ® X + O2
__________________
net: O3 + O ® 2 O2
X and XO are not
destroyed in these reactions, but simply cycle one into the other. For each cycle, however, O + O3 ® 2O2. This cycle is catalytic in the destruction of
Ox and thus O3.
These reactions are
generally fast enough to be considered to be in steady state. Usually, the rate-limiting step is the XO + O
reaction. The loss rate of ozone due to
this catalytic cycle is equal to 2 k [XO] (Johnston and Podolske, 1978). Catalytic cycles that recombine two ozone
molecules into three oxygen molecules also catalytically destroy ozone.
Many chemical
cycles can be formed. Some of these will
neither produce or destroy ozone and are called null cycles. Other cycles do not involve ozone at all but
switch members of chemical families from one form to another. These cycles are dominant processes in stratospheric
chemistry and contribute indirectly to ozone loss.
Stratospheric
Chemical Species
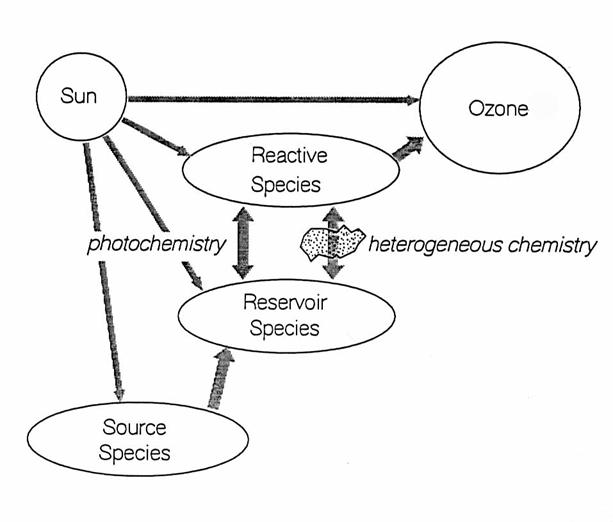
Chemical species
for each chemical family have different functions in stratospheric chemistry ,
as in the following figure and table.
The source species are generally those chemicals that live long enough
in the troposphere to survive transport to the stratosphere. Once they reach the stratosphere, sources
species are destroyed, either directly by absorption of solar ultraviolet
light, or by chemical reactions that are initiated by solar UV. Some products of the photochemical destruction
of the source species are either reactive or reservoir species. In this chapter, “reactive” indicates free
radicals and other chemical species that are photolyzed into free radicals
within minutes. “Reservoir” indicates species such as acids and nitrates that
are exchanged with free radicals by reactions or photolysis, but generally over
a period of hours to months. All
reactive and reservoir species are “trace” species, and have volume mixing
ratios of less than 20 parts per billion by volume (ppbv = 10-9) in
air.
|
Table 1. Source, reservoir,
and reactive chemicals in the stratosphere |
|||||
|
species/family |
Oxygen |
Hydrogen |
Nitrogen |
Chlorine |
Bromine |
|
source |
O2 |
H2O CH4 |
N2O |
CH3Cl CFCs HCFCs |
CH3Br Halons |
|
reservoir |
Ox = O + O3 |
H2O2 HNO3 HO2NO2 HOCl HOBr |
HNO3 ClONO2 N2O5 HO2NO2 |
HCl ClONO2 HOCl OClO BrCl |
HBr BrONO2 BrCl HOBr |
|
reactive |
O O3 |
OH HO2 |
NO NO2 NO3 |
Cl ClO Cl2O2 |
Br BrO |
Another important
trace component is aqueous particles. They
are primarily sulfate aerosol throughout the lower stratosphere below 25 km,
called the Junge layer, but become polar stratospheric clouds (PSCs) in the
cold, wintertime polar regions. The
surface area density (cm2 per cm 3 of air) and the composition
of the particles affect stratospheric heterogeneous chemistry through the first
order rate constant given in equation (1-9). Sporatic volcanic eruptions inject
large amounts of sulfur into the stratosphere, so that the surface area varies
in the range of (0.5 - 20) x 10-8 cm2 cm-3. In addition,
condensible chemicals such as H2O and HNO3 deposit
on the aerosol at low temperatures, swelling them. Third, the composition affects the uptake and
reaction efficiency, g, which varies from < 10-5 to almost 1.
The chemical effects of particles
appear to be limited to below 25 km, but they are profound.
The predominant
exchange among source, reservoir, and reactive species is either by photolysis
or chemical reactions or by heterogeneous chemistry. Only sunlight and reactive species can
directly affect the ozone amount.
However, reservoir species have an indirect influence because
photochemistry and heterogeneous chemistry determine the balance between the
reactive and reservoir species and thus amounts of the reactive species.
Because most source
gases enter the stratosphere through the tropics and leave at high latitudes,
the chemical species and reactions are the same throughout the
stratosphere. However, which chemical
species and reactions are most important differs from the tropics to the
wintertime polar region. The tropics,
the main entry point for gases into the stratosphere, are a region of extensive
photochemical production, where an abundance of sunlight and reactive species
begin to convert source gases into reservoir and reactive species. The wintertime polar region in the lower
stratosphere is heavily influenced by the heterogeneous chemistry that occurs
on the cold aqueous particles there, and ozone loss dominates production. The middle latitudes are a region where
photochemical production and loss are more in balance than in the other two
regions. These three regions are connected by transport, but semipermeable
barriers appear to prevent rapid mixing from one region to the other.
Chemistry of the
Tropics and Middle Latitudes
Source Gases
The source gases
for all of the chemical families originate at Earth’s surface, even molecular
oxygen (Table 1). Some gases are not in
this table. Sulfur gases, such as SO2
and OCS, also enter the stratosphere in significant amounts, but they usually
end up as sulfate aerosol within a few months.
CO2 also enters the stratosphere, but its main influence on
stratospheric chemistry comes from its absorption and emission of infrared
radiation that can alter stratospheric temperatures. Noticeably absent from this list of sources
are non-methane hydrocarbons and soluble gases that dominate tropospheric
chemistry. These chemicals do not
survive the oxidation and precipitation in the troposphere to enter in the
stratosphere in amounts capable of affecting the chemistry. Stratospheric chemistry originates from only
a few chemicals.
The destruction of most source gases occurs as they are transported up
into the tropical stratosphere. Source gases develop vertical profiles with
greatest mixing ratios near the tropopause.
As these gases are transported away from the tropics, their destruction
decreases.
Oxygen Species.
Photolysis of O2 is
the only source of O3 and O,
Ox, in the stratosphere, as in the figure below. Local sources of NOx in the lower
stratosphere can act as Ox sources by the photochemical smog
reactions, but these are a smaller source than the photolysis of O2.
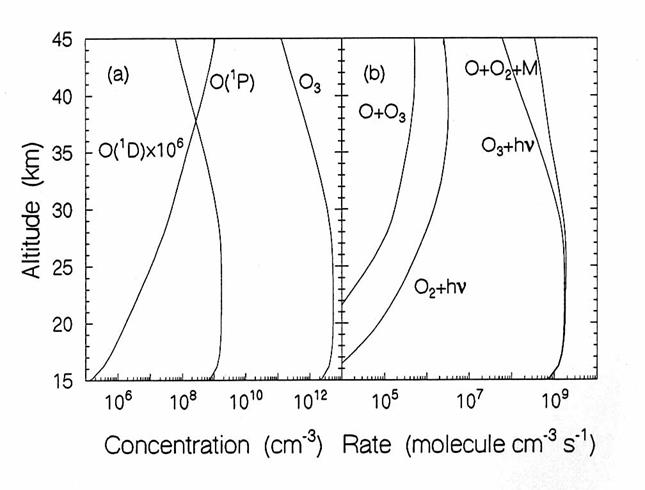
The vertical diurnally-averaged distributions of (a) the concentrations
(molecules cm-3) and (b) the reaction rates (molecules cm-3
s-1) for the oxygen chemical family.
Calculations are for June at 38oN by the AER 2-D model. O(1D) is oxygen in the first
excited electronic state; O(3P) is atomic oxygen in the ground
state. (from D. Weisenstien and J.
Rodriguez, private communication)
Hydrogen Species.
Hydrogen has two main sources: H2O and CH4, as
below. The O(1D) produced by O3 photolysis reacts with H2O
to produce 2 OH molecules. Methane is
oxidized by OH and undergoes an oxidation sequence that leads to CO2
and H2O. This sequence
creates about two water molecules from each fully oxidized CH4
molecule. The result is that the sum of
mixing ratios of 2 x CH4 + H2O is approximately constant at
6 -7 ppmv throughout the stratosphere.
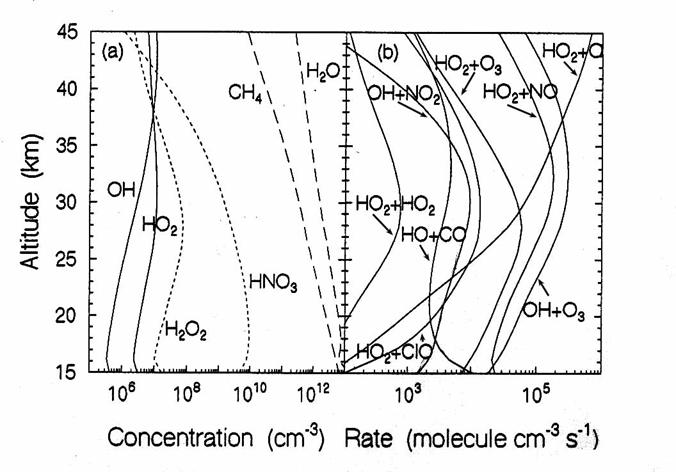
The vertical diurnally-averaged distributions of (a) the concentrations
(molecules cm-3) and (b) the reaction rates (molecules cm-3
s-1) for the hydrogen chemical family. Calculations are for June at 38oN
by the AER 2-D model. For
concentrations, long dashes, short dashes, and solid lines indicate source,
reservoir, and reactive species. For reaction rates, the reactants indicate the
reaction. (from D. Weisenstien and J. Rodriguez, private communication)
Nitrogen Species. Reactive and reservoir nitrogen, called NOy,
has three sources in the stratosphere, as below (WMO, 1994): N2O
reacting with O(1D) to form NO by the reaction N2O + O(1D)
® 2 NO (65%); solar proton events and galactic cosmic rays
producing NO (10%); and lightning in the equatorial upper troposphere producing
NO that is transported into the stratosphere (25%). These estimates are highly uncertain,
especially the estimate for the lightning source. Nitrous oxide is the largest source of reservoir
and reactive nitrogen. The largest sink
of stratospheric N2O is photolysis, N2O + hn ® N2 +
O. Only 7% of the N2O reacts
with O(1D) to form NO (Fahey et al., 1989). In addition, NO can be destroyed in the upper
tropical stratosphere by the photolysis of NO to produce N and O, followed by
the reaction N + NO ® N2 +
O. This sink of NO may result in a loss
of 20% of the total stratospheric NOy as it leaves the tropics for
middle latitudes.
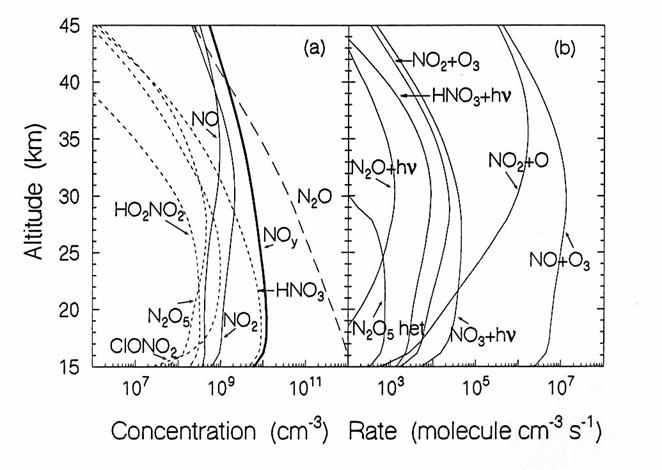
The vertical diurnally-averaged distributions of (a) the concentrations
(molecules cm-3) and (b) the reaction rates (molecules cm-3
s-1) for the nitrogen chemical family. Calculations are for June at 38oN
by the AER 2-D model. For
concentrations, long dashes, short dashes, and solid lines indicate source, reservoir,
and reactive species. For reaction
rates, the reactants indicate the reaction.
(from D. Weisenstien and J. Rodriguez, private communication)
Chlorine Species. The main source gases for the 3.7 ppbv
of stratospheric chlorine in 1995 are the long-lived chlorofluorocarbons (CFCs)
at 2.7 ppbv, the anthropogenic methyl chloroform (CH3CCl3),
the largely natural methyl chloride CH3Cl at 0.6 ppbv, and
increasingly the hydrochlorofluorocarbons (HCFCs) designed to replace the CFCs,
as below. The most important CFCs are CFC-11 (CCl3F), CFC-12 (CCl2F2),
CFC-113 (CCl2FCClF2), and carbon tetrachloride (CCl4).
Other small chlorine sources such as volcanos and solid fuel rockets contribute
less than 1% of the total stratospheric chlorine burden (WMO, 1994). The tropospheric mixing ratios of the CFCs
and methyl chloroform are peaking, thanks to the Montreal Protocol.
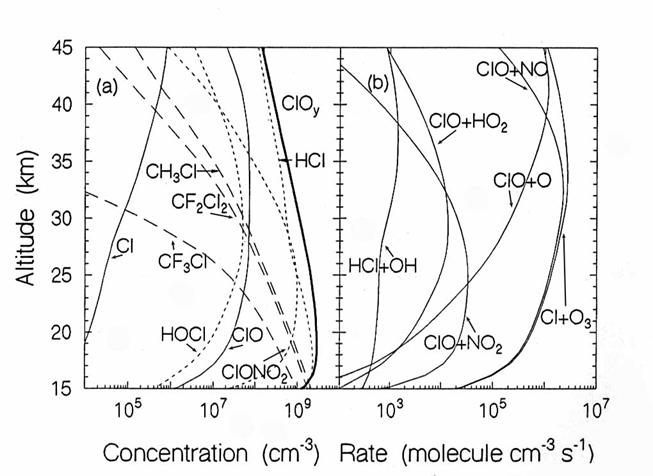
The vertical diurnally-averaged distributions of (a) the concentrations
(molecules cm-3) and (b) the reaction rates (molecules cm-3
s-1) for the chlorine chemical family. Calculations are for June at 38oN
by the AER 2-D model. For
concentrations, long dashes, short dashes, and solid lines indicate source,
reservoir, and reactive species. For the
reaction rates, the reactants indicate the reaction. (from D. Weisenstien and
J. Rodriguez, private communication)
The only significant sink for CFCs is photochemical destruction in the
stratosphere. Most stratospheric
destruction is by photolysis. Methyl
chloride is predominantly destroyed by OH in the troposphere, but the main
stratospheric sink is photolysis. The
HCFCs are also mostly lost to tropospheric OH, but once they are in the
stratosphere, they are mainly destroyed by photolysis. Measurements confirm that chlorine species
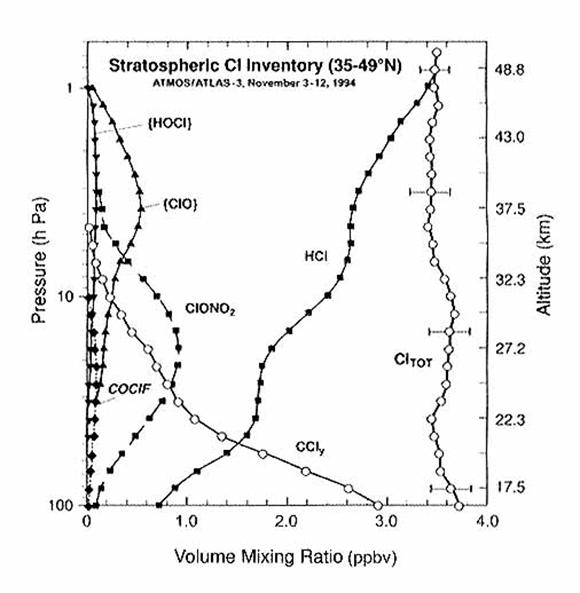
are stripped of all their chlorine atoms.
These chlorine atoms are incorporated into inorganic chlorine reservoir
and reactive species, collectively called Cl y. The total amount of chlorine, which contains
both the organic and the inorganic forms, should be conserved with
altitude. We see from the following
figure that it is.
Bromine Species.
The major sources of 20 pptv of stratospheric bromine are methyl bromide
(CH3Br) at 12 pptv, halon 1211 (CBrClF2) at 2.5 pptv, and
halon 1301 (CBrF3) at 2.0 pptv in the next figure. Because a large fraction of methyl bromide is
anthropogenic, the total anthropogenic bromine contribution to the stratosphere
is about 40-50%. The bromine atoms
incorporated into stratospheric bromine reservoir and reactive species are
collectively called Bry
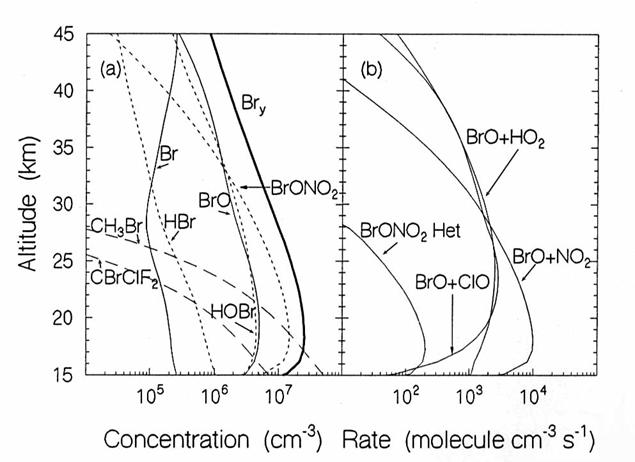
The vertical
diurnally-averaged distributions of (a) the concentrations (molecules cm-3)
and (b) the reaction rates (molecules cm-3 s-1) for the
bromine chemical family. Calculations
are for June at 38oN by the AER 2-D model. For concentrations, long dashes, short
dashes, and solid lines indicate source, reservoir, and reactive species. For the reaction rates, the reactants indicate
the reaction. (from D. Weisenstien and J. Rodriguez, private communication)
Other Halogen
Species. The major source of
stratospheric fluorine is the CFCs. The
fluorine atoms, once released from the CFCs by photochemistry, rapidly is
incorporated into HF, which does not participate in stratospheric
chemistry. Source molecules such as SF6,
C2F6, and CF4, which are being used more
widely, are very stable and have lifetimes of thousands of years. Fluorine
plays essentially no known role in
stratospheric chemistry.
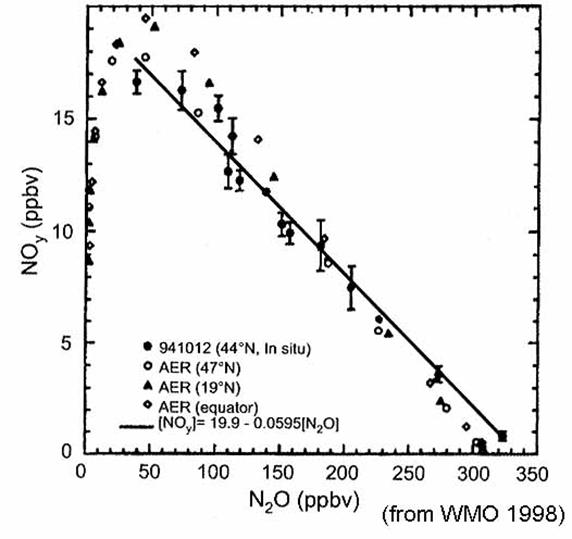
Long-lived species,
such as the source gases N2O, CH4, CFCs, and the sums of
reservoir and reactive species NOy, Cly, and Bry,
tend to be well-mixed along the quasi-horizontal mixing surfaces. Because the time constant for the destruction
(or production) of these long-lived species is faster than vertical mixing but
slower than horizontal mixing, long-lived chemical species develop vertical
gradients and compact, simple relationships one to the other. These compact relationships have been observed
and are used to determine the amount of one long-lived tracer, be it source gas
or inorganic product, from others. Some
observationally determined relationships for NOy vs N2O
in 1989 and Cly vs N2O
in 1992 are given by the equations:
NOy (ppbv) = 0.082 (266 -
N2O (ppbv)) (Fahey et al.,
1989) (13)
Cly (ppbv) = 2.79 + 4.1x
10-3 N2O (ppbv) - 4.0x10⁻⁵ {N2O
(ppbv)}2
(Woodbridge
et al, 1995) (14)
These relationships
apparently do not hold in the tropics, where most of the source destruction is
occurring. From observations of N2O mixing ratios, the mixing ratios
of other long-lived source gases, NOy, Cly, and Bry
can be found. Once NOy, Cly,
and Bry are known, the partitioning into reservior and reactive
species is determined by photochemistry alone, without regard to transport.
The Partitioning
Between Reservoir and Reactive Gases
Photochemistry and
heterogeneous chemistry influence the partitioning of the chemical families (NOy,
Cly, Bry) into reservoir and reactive species. Thus they determine the amount of reactive
species and are controlling factors in ozone loss. These processes depend upon temperature,
pressure, amount of sunlight, and aqueous particle surface area and
composition. They vary for different
seasons, latitudes, altitudes, and aerosol loadings due to volcanic eruptions.
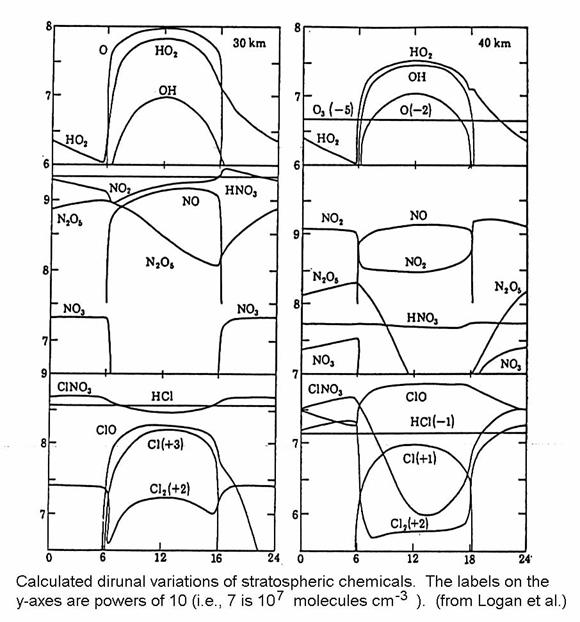
Reactive species
are present mostly during sunlight, as in the figure below. Often, diurnally-averaged concentrations and
reaction rates are used for model calculations of many years of atmospheric
chemistry. Generally, such calculations
correctly represent the chemistry, but they do not correctly represent diurnal
variations. The lifetimes of chemical
species can be found by dividing the concentration of the species by the
reaction rates. However, caution must be
used when finding the lifetimes of diurnally varying species with
diurnally-averaged model results.
Hydrogen Family. The reactive species in the hydrogen family,
the hydroxyl radical OH and the hydroperoxyl radical HO2, together
are called HOx. The reservoir
species are H2O2, HNO3, HO2NO2,
HOCl, and HOBr. Hydrogen peroxide is
formed by the reaction:
HO2
+ HO2 ® H2O2
+ O2 hours (15)
and is destroyed by
photolysis to yield OH:
H2O2
+ hn® 2 OH hours (16)
The other reservoir
species result from reactions with the other chemical families. Of these, the most important is HNO3,
which augments H2O as a source of HOx in the lower
stratosphere.
The main
interactions with the halogen families are the reactions:
HO2
+ ClO ® HOCl + O2
minutes-hour (17)
HO2
+ BrO ® HOBr + O2 minutes (18)
OH + HCl ® H2O +
Cl days-weeks (19)
OH + HBr ® H2O +
Br day (20)
The halogen
reservoirs, HOCl and HOBr, are short-lived. The reactions of OH with HCl and HBr
are not important losses of OH, but are important reactions for the chlorine
and bromine families.
The exchange
between OH and HO2 occurs mainly by the reactions:
HO2
+ NO ® OH + NO2
minutes (21)
OH + O3
® HO2 + O2
minutes (22)
HO2
+ O3 ® OH + 2 O2
minutes-hour (23)
OH + O ® H + O2 seconds-hour (24)
HO2
+ O ® OH +O2 seconds-hour (25)
H + O2
+ M ® HO2 + M second (27)
These fast
reactions establish a steady state relationship between HO2 and OH
in a few minutes:
![]()
Throughout most of
the stratosphere, the predominant conversion from HO2 to OH is the
reaction with NO. This exchange is
hundreds of times more rapid than the conversion of HOx into its
reservoir species. The ratio [HO2]/[OH] is approximately 1 in the
upper stratosphere, but is larger than 10 in the lower stratosphere.
Nitrogen Family. The nitrogen family is represented by the
sum, NOy = HNO3 + ClONO2 + BrONO2 +
HO2NO2 + NO2 + NO + NO3 + 2 N2O5
+ HONO + N + aerosol nitrate. This
family is sometimes called odd-nitrogen.
The stratospheric NOy mixing ratio is typically 4 to 12 ppbv,
with the higher values in middle latitudes.
The reactive species NO and NO2 together are called NOx. The NOx/NOy ratio
indicates the ability of NOy to influence ozone destruction in an
airmass.
The gas-phase
reactions that partition the family into reservoirs and radicals and their
approximate time constants for converting nitrogen are:
HNO3 + hn ® OH + NO2
day-weeks (29)
OH + NO2 + M ® HNO3 +
M hours-weeks (30)
HNO3 + OH ® NO3 + H2O weeks (31)
ClONO2 + hn ® Cl + NO3
hours (32)
ClO + NO2 + M
® ClONO2
+ M hour (33)
BrONO2 + hn ® Br + NO3
minutes (34)
BrO + NO2 + M
® BrONO2
+ M hour (35)
NO2 + O3
® NO3 + O2 day(s) (36)
NO3 + hn ® NO2 + O seconds (37)
NO2 + NO3
+ M ® N2O5
+ M hours (38)
N2O5
+ hn ® NO2 + NO3 hours (39)
NO + O3 ® NO2 + O2
seconds (40)
NO2 + O ® NO + O2 minutes-hours (41)
In competition with
the gas-phase reactions are the heterogeneous reactions on sulfate aerosol in
the lower stratosphere. The most
important of these is the hydrolysis of N2O5:
N2O5
(gas) + H2O (liquid) ® 2 HNO3 (gas) hours to days (42)
Other heterogeneous
reactions are the hydrolysis of ClONO2 and BrONO2:
ClONO2 (gas) +
H2O (liquid) ®
HOCl(liquid) + HNO3(liquid) days
to weeks (43)
BrONO2 (gas) +
H2O (liquid) ®
HOBr(liquid) + HNO3(liquid) hours
to days (44)
where the shorter
time constants are for volcanic aerosol clouds and the longer for background
aerosol amounts. N2O5
and BrONO2 hydrolysis are almost temperature-independent, where as
ClONO2 hydrolysis competes with gas-phase chemistry only when T <
205K. Thus, while ClONO2
hydrolysis is important only in cold regions, N2O5
hydrolysis and BrONO2 hydrolysis affect chemistry throughout the
lower stratosphere.
In regions where
heterogeneous chemistry is important, the interaction between gas-phase and heterogeneous
chemistry results in a “saturation” of N2O5 hydrolysis,
in which the addition of aerosol surface area does not significantly change the
balance between reservoir and reactive NOy, as represented by the NOx/NOy
ratio. The gas-phase reactions that
determine the N2O5 concentration are reactions (36) -
(39). In the lower stratosphere,
particularly in the high latitudes in winter, the hydrolysis of N2O5
is as fast as the gas-phase chemistry.
The net result is that for a large range in aerosol loadings, the effect
of this N2O5 hydrolysis on the NOx/NOy
partitioning is approximately constant (Fahey et al., 1993).
Chlorine
Family. The chlorine family
is represented by the sum Cly = HCl + ClONO2 + HOCl + ClO
+ 2 Cl2O2 + OClO + BrCl + Cl. In the middle latitudes, the total amount of
Cly is 2 to 3.5 ppbv.
Throughout much of the tropical and middle latitude stratosphere, more than 80% of the 3.7 ppbv of chlorine is
in the reservoir species HCl, ClONO2, and HOCl. In the lower stratosphere, the reactive
species ClO and Cl concentrations are only 5 - 30 pptv, at most a few percent
of Cly.
For some
conditions, HCl is the dominant reservoir; for others, ClONO2 is.
The HCl reservoir is created by the reaction of Cl with CH4 and CH2O
and is destroyed by the gas-phase reaction with OH. Its lifetime is generally weeks to
months. The ClONO2 reservoir
is created by the reaction of ClO with NO2 and is destroyed mainly
by photolysis. Its lifetime is generally
weeks.
HOCl is only a few percent
of the total chlorine reservoir because it is so rapidly lost by
photolysis. Its lifetime is only a few
hours. Which reservoir is dominant
determines the amount of reactive chlorine that will be present during the day.
The reservoir
species OClO and BrCl result from a reaction between the bromine and chlorine
families:
C1O
+ BrO ® Br + OC1O minutes-hours (45a)
® BrC1 + O2 (45b)
® Br + C1OO (45c)
These are not
important chlorine reservoir species in the tropics and middle latitudes.
However, while pathway is part of a null cycle, pathways b and c of this
reaction are part of a catalytic cycle that destroys ozone throughout the lower
stratosphere.
During the night,
all the chlorine is in the reservoir species.
However, during the day,
ClONO2
is photolyzed and a balance is maintained which is defined by the steady-state
relationship:
![]()
The photolysis time
constant is a few hours, and the recombination is tens of minutes. As a result, ClONO2 is the larger
of the two species. In the upper
stratosphere, where termolecular reactions are slower and photolysis is faster,
a greater fraction is present as ClO.
For a given amount of ClONO2, the amount of ClO during the
day is inversely dependent upon [NO2]. Because NO2 is reduced by N2O5
hydrolysis, more ClO will be present during the day in the presence of volcanic
aerosols or in the lower stratosphere at high latitudes.
The exchange
between ClO and Cl is mainly by the reactions:
ClO
+ NO ® Cl + NO2
minute (47)
Cl + O3 ® ClO + O2
second (48)
ClO
+ O ® Cl + O2
minutes (49)
This exchange is in
steady-state, and the [Cl]/[ClO] ratio is:
![]()
Below 35 km, the
reaction between ClO and NO is at least ten times faster than the reaction of
ClO with O, so that the amount of chlorine is approximately proportional to the
amount of reactive nitrogen. In the
upper stratosphere, the ClO reaction with O becomes important, and with
decreasing [O3] the ratio [Cl]/[ClO] increases to approximately 0.01
above 40 km. When [Cl] is larger, more
HC1 is created because the reaction rate of Cl + CH4 ® HCl + CH3
increases.
Bromine Family. The bromine family is represented by the sum
Bry = HBr + BrONO2 + HOBr + BrO + BrCl + Br. Its abundance is 10 - 20 pptv throughout the
stratosphere (Schaeffler et al., 1994).
The bromine family has the same reactions as the chlorine family. However, differences between the two halogens
make a large difference in the partitioning between the reservoir and radical
species. First of all, the photolysis
rate coefficient for BrONO2 is about 50 times larger than that for
ClONO2 in the lower stratosphere.
Second, the reaction of OH with HBr is about 20 times faster than the
reaction of OH with HCl. As a result,
the amount of bromine that is in the form of BrO during the day is roughly 50%
of Bry. HBr is at most about
10% of Bry. The large BrO/Bry
ratio makes bromine competitive with chlorine for ozone destruction in the
lower stratosphere despite the large differences between the Bry and
Cly abundances.
Significance of the
Interactions Among the Chemical Families
The nitrogen family
controls the hydrogen and halogen families for most stratospheric
conditions. This control results from
the abundance of NOy being greater than that of HOx, ClOy,
or Bry. The direct control of
chlorine and bromine is by the formation of ClONO2 and BrONO2. For HOx, this control is exerted
mainly through the formation of nitric acid (15). Because NOx controls HOx,
and HOx in part controls the amount of HCl and HBr, NOx
also indirectly controls even the amount of HCl and HBr. This control is strongest in the lower
stratosphere.
Heterogeneous chemistry
converts nitrogen species from reactive to reservoir species and from reservoir
to long-lived reservoir species, while it converts halogen species from
reservoir species to reactive species.
The rough differences for three chemistries - gas-phase, in the presence
of sulfate aerosol, and in the presence of polar stratospheric clouds - show
these trends for the nitrogen and chlorine families. Reactive hydrogen, like reactive halogens,
tend to be suppressed when NOx is greater.
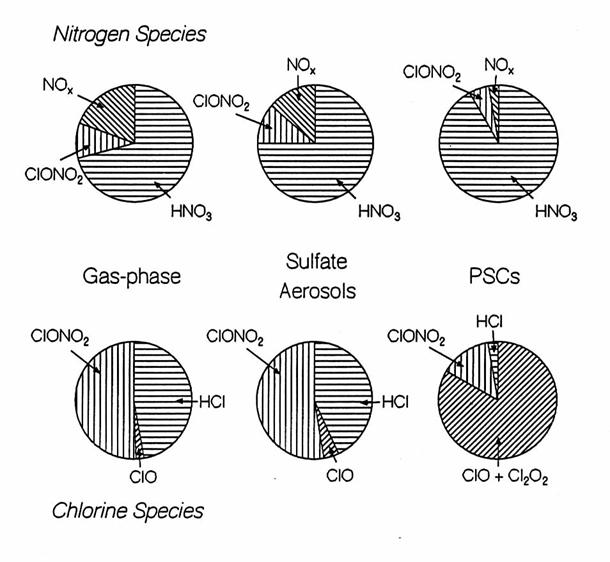
Illustrations of the chemical budgets for the nitrogen and chlorine
chemical families for three different conditions: gas-phase chemsitry only,
heterogeneous chemistry on sulfate aerosols, and heterogeneous chemistry on
PSCs. The exact partitioning is very
dependent upon season, latitude, and trajectory of the air. Some more minor chemical species are not
shown.
Ozone Loss in
Middle Latitudes and the Tropics
Ozone loss at
middle latitudes and the tropics occurs by catalytic cycles involving reactive
species, as presented above. Hence, an
important catalytic cycle for the upper stratosphere is:
OH
+ O3 ® HO2 + O2
HO2
+ O ® OH + O2
__________________
net: O3 + O ® 2 O2
Similar cycles
exist for NO2, ClO, and BrO. Additional
cycles involve reactions with ozone only:
HO2
+ O3 ® OH + 2 O2
OH + O3 ® HO2 + O2
____________________
net:
2 O3 ® 3 O2
and
NO + O3 ® NO2 + O2
NO2
+ O3 ® NO3 + O2
NO3
+ hν ® NO
+ O2
____________________
net:
2 O3 ® 3 O2
These cycles
involve only one chemical family acting on Ox. However, other catalytic cycles involve the
reactions of reactive species from more than one chemical family. A large number of these catalytic cycles
exist. Some of the most important are
the halogen-halogen and the halogen - hydrogen cycles:
ClO + BrO ® Br + Cl + O2
Br + O3 ® BrO + O2
Cl + O3 ® ClO + O2
_______________________
net: 2
O3 ® 3 O2
HO2
+ ClO ® HOCl +O2
HOCl + hν ® OH + Cl
Cl + O2 ® ClO + O2
OH + O ® HO2 + O2
____________________
net: O3 + O3 ® 3 O2
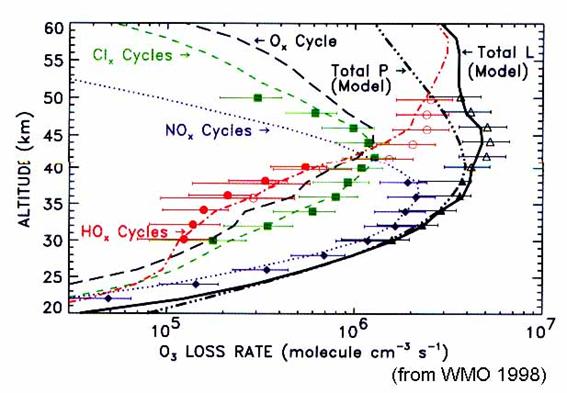
The importance of
these various cycles will depend upon the location, season, and altitude (Figure
18). The hydrogen and halogen catalysis
destruction of ozone are greater than nitrogen catalysis below 20 km and near
40 km; nitrogen catalysis is largest in between. In the winter and spring at high latitudes,
hydrogen and halogen catalysis dominate up to 23 km. Interestingly, the ozone trends in Figure 6
are greatest exactly where the chlorine and bromine increase have the greatest
influence on ozone: below 20 km and near 40 km.
When NOx
changes, either by an increase in the total NOy or by a shift in the
partitioning between reservoir and reactive species within the nitrogen family,
the close chemical coupling with the hydrogen and halogen chemical families
causes a shift in their partitioning as well.
Generally, an increase in NOx results in a decrease in both
HOx and ClOx. As a
result, smaller amounts of hydrogen and halogen reactive species destroy less
ozone, while nitrogen reactive species destroy more. At low [NOx], ozone is destroyed
primarily by halogens with a large contribution from hydrogen reactive
species. As [NOx] increases,
the more reactive halogen and hydrogen species are controlled by the increasing
[NOx], so that the overall ozone loss rate decreases, and a minimum
in the ozone loss rate occurs.
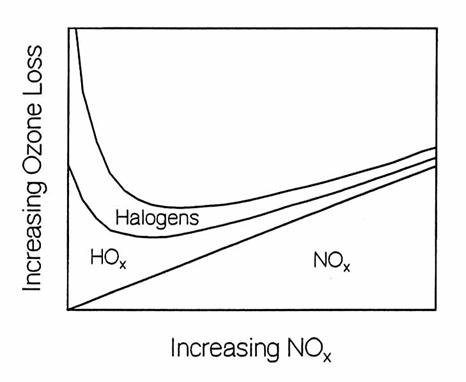
Ozone destruction rates in the lower stratosphere at middle latitudes
as a function of NOx. At low
NOx, O3 destruction is dominated by the faster hydrogen
and halogen catalytic cycles. At high NOx,
hydrogen and halogen reactive species are converted to reservoir species and
nitrogen catalytic cycles doiminate ozone loss. (adapted from Wennberg et al.,
1994).
Even in the case of
low aerosol loading, the current atmosphere is near the minimum in ozone loss
in the lower stratosphere. Higher in the
stratosphere, where NOx dominates ozone loss, any changes in NOx
translate into an almost comparable fractional change in the ozone loss.
Can these catalytic
cycles explain the ozone losses observed in the middle latitudes? Not
entirely. Current models can simulate
the observed summertime losses but calculate the only about 1/2 of the observed
wintertime loss in the Northern Hemisphere (WMO, 1994). Chemical processes from within or near the
wintertime Arctic polar vortex may cause the additional ozone loss if polar air
mixes sufficiently into the middle latitudes.
Another possibility is some additional halogen chemistry that is missing
from the models. Both possibilities are
being aggresively studied.
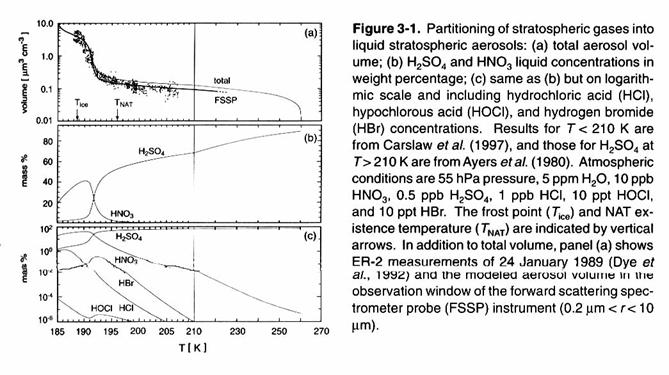
Stratospheric aerosols.
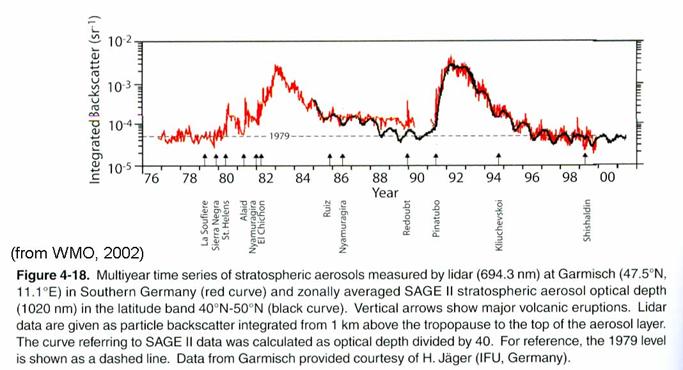
Stratospheric
aerosols are composed many of sulfuric acid and water. They exist in the lowest 10 km of the
stratosphere. While oceanic sulfur
compounds may be the background cause of stratospheric aerosol, the amount of
aerosol increases by more than a factor of 10 after volcanic eruptions that are
able to inject gases directly into the stratosphere. Since the eruption of Mt. Pinatubo in the
early 1990’s, there has not been another large eruption. As a result, stratospheric aerosol is at the
lowest concentration that has ever been observed, as in the figure.
Wintertime
Observations,
laboratory studies, and modeling studies have firmly established that chlorine
and bromine chemistry cause the observed rapid ozone loss over Antarctica each
October (WMO, 1994). They also show that
chlorine and bromine chemistry cause significant ozone loss of about 10-20% of
the ozone column in the Arctic each February.
Although the photochemistry of the wintertime polar regions appears to
be unique, in reality it represents the extremely low NOx case in
Figure 19. A different set of reactions
become most important because of the meteorological conditions of the
wintertime polar regions.
The chemistry
responsible for the Antarctic ozone hole begins when the sun retreats to the
Northern Hemisphere in April. A
circumpolar jet in the middle stratosphere picks up strength and the
temperatures poleward of the jet begin to fall.
The air in this region has spent 3 years in the stratosphere and much of
the source gases has been converted to reservoir and reactive species. Air cools and descends for the next six
months, and air inside the vortex, while shed by the vortex into middle
latitudes, remains generally isolated from the air from middle latitudes.
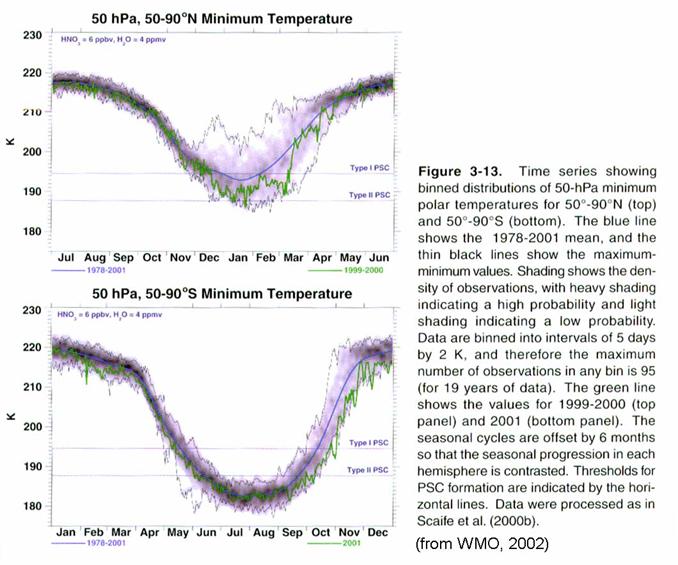
As the temperatures
continue to fall below 205 K, the sulfate aerosols swell with water vapor and
nitric acid.
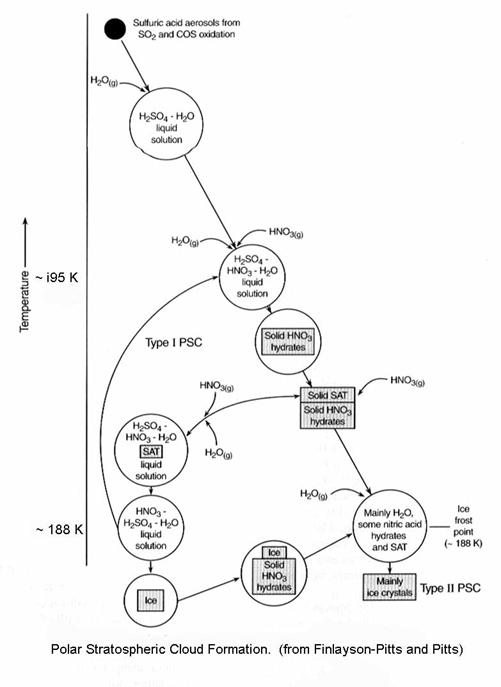
Another view of the
process is the following figure, which shows how the size and composition of
the PSCs change with temperature. Here,
we assume that there is 5 ppmv of water vapor, a pretty typical number for this
region of the stratosphere.
These aerosols are
larger and the hydrolysis of N2O5, ClONO2, and
BrONO2 are accelerated. As
the temperature continues to fall below 200 K, more HCl is incorporated into the aerosol, and
heterogeneous reactions involving HCl become more important, particularly the
reactions:
|
HCl +
ClONO2 ® Cl2 + HNO3 hours (56) HCl +
HOCl ® Cl2 + H2O hours (57)
|
These reactions
become even faster, with time constants of about an hour, at lower temperatures
just below 195 K, when polar stratospheric clouds (PSCs), made of frozen water
and nitric acid, form. If the temperature
reaches the water vapor frost point, near 185 K for the lower stratosphere and
4.5 ppmv of water vapor, then the PSCs can grow to a few microns in size, large
enough to settle out of the stratosphere within a few days, taking the HNO3
with them.
Heterogeneous
chemistry on cold aqueous particles, particularly PSCs, initiates the chemical
sequence that leads to the observed rapid ozone loss. By this process, nitrogen species are shifted
into HNO3, which is bound up into PSCs as long as the temperature
remains below 195 K, and chlorine and bromine species are converted from the
HCl and ClONO2 reservoir forms into Cl2 and BrCl. Because Cl2 and BrCl are quickly
photolyzed in weak, visible sunlight, the resulting Cl and Br atoms react with
O3 within milliseconds to form ClO and BrO. Normally, ClO and BrO would react with NO2
to form ClONO2 and BrONO2. However, because NOx is shifted
into HNO3 by heterogeneous chemistry, ClO and BrO become the
dominant species in their respective chemical families.
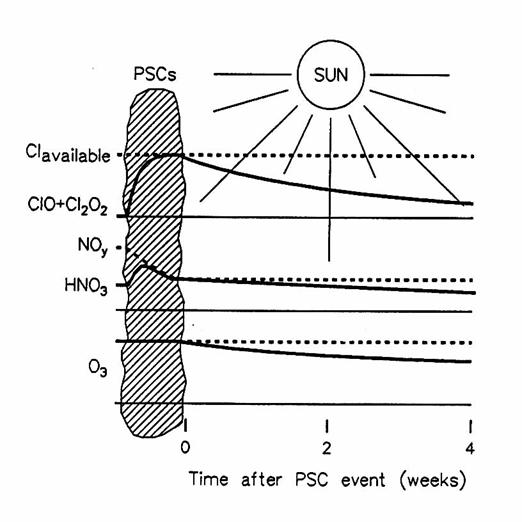
A diagram showing the effect of PSCs and sunlight on concentrations of
trace gases and ozone. Dotted lines
indicate available chlorine, reactive nitrogen, and initial O3;
solid lines indicate reactive chlorine (ClO and Cl2O2),
HNO3, and O3. (from
Brune et al., 1991)
Under these
circumstances, a new catalytic cycle becomes the most important for ozone loss:
ClO
+ ClO + M ®
Cl2O2 + M
Cl2O2
+ hν(λ,250 nm) ® Cl + ClOO
ClOO
+ M ® Cl + O2
+ M
2(
Cl + O3 ® ClO + O2)
_______________________________
net: 2 O3 ® 3 O2
In the cold polar
regions, the rate-limiting step in this catalytic cycle is the formation of Cl2O2
during daylight. During the day, ClO
mixing ratios can approach 1 to 1.5 ppbv.
BrO becomes an even larger fraction of Bry, and the catalytic
cycle 1-54, with the reaction ClO + BrO ® Br + ClOO (and BrCl + O2) becomes the second
most important destruction mechanism.
Other cycles contribute, but these are the main two.
The ozone destruction
rate by these cycles is written as:
![]()
At temperatures
above 215 K, the thermal decomposition
of Cl2O2 becomes important, so that the ozone destruction
rate is modified by the fraction of Cl2O2 that is photolyzed
compared to the total that are destroyed by photolysis and thermal
decomposition, f(photolysiis).
In the lower stratosphere, where [M] = 2 x 1018 cm-3,
cClO = 1 ppbv, cBrO = 7 pptv, the loss
rate of ozone can approach 1 to 3 percent per day in sunlit parts of the
vortex. Thus, the total removal of ozone
from the vortex can occur in about 50 days.
Evidence that ClO
and BrO cause ozone loss was observed by instruments on the NASA ER-2 aircraft
during the Airborne Antarctic Ozone Expedition to Punta Arenas, Chile in August
and September, 1987. The edge of the
polar vortex on this date was at approximately 67 o S.
In August, the ozone inside the vortex shows no significant loss, even
though the ClO mixing ratio is large.
However, a month later, the ozone mixing ratio inside the vortex has
decreased to a third of the outside value.
Calculations using the observed ClO, BrO, and O3 from 12
flights in 1987, combined with knowledge of the amount of descent of the air
and the rate constants, show that the calculated change in ozone agrees with
the observed change in ozone to within the uncertainty of the calculation (Anderson et al., 1989; Solomon et al.,
1990). This agreement has been found in
the Arctic as well.
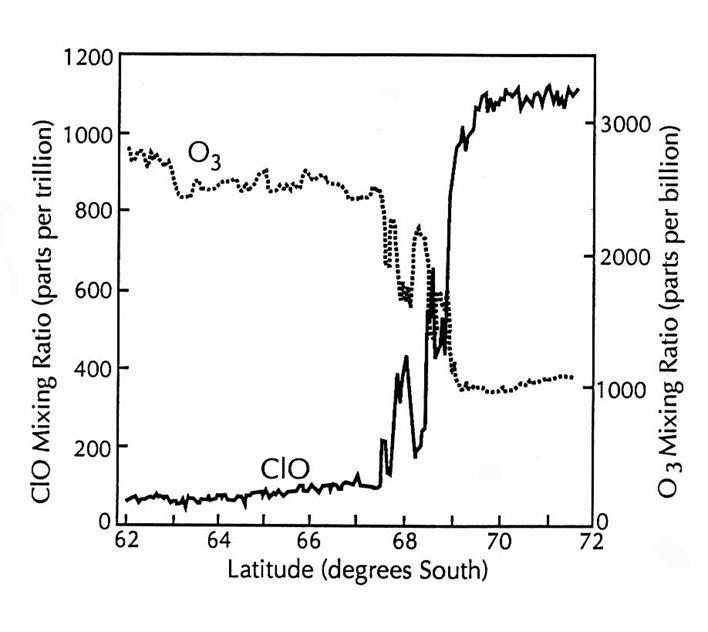
Simultaneous meaurements of ClO and O3 over Antarctica on 16
September 1987 during the Airborne Antarctic Ozone Expedition. The boundary of the ozone-depletion region at
69oS is clearly shown by the rapid increase in ClO mixing ratio and
the rapid decrease in O3 mixing ratio. The rapid fluctuations of anticorrelated ClO
and O3 at the boundary indicate the shedding of air from the
vortex. (adapted from Anderson et al.,
1991)
The PSCs do not
constantly exist and usually do not fill the vortex, especially in the Northern
Hemisphere. When the air warms above 195
K, the PSCs evaporate and release the HNO3 back into the gas-phase. The same sunlight that photolyzes Cl2O2
to destroy ozone also photolyzes HNO3 to form NO2, which
immediately and almost exclusively reacts with ClO to form ClONO2. This reaction reduces the ClO amount, and
slows the ozone catalysis. Thus, massive
ozone loss is possible only if the ClO mixing ratio remains large, which
requires that the NOx mixing ratio remain low.
NOx
concentrations remain lowest in the Antarctic polar vortex. First, the air inside the vortex is
relatively isolated from the NOy-rich air of the middle
latitudes. Second, the temperature
usually drops below the frost point so that the PSCs become ice covered and a
few microns in size. When they settle
out, they carry much of the NOy with them, leaving only a few ppbv
behind. Third, because the temperatures
remain low through August, PSCs are frequently reformed, thus continually
shifting nitrogen from ClONO2 back into HNO3. Under these conditions, almost complete ozone
loss is possible in the volume of air that has been exposed to PSCs.
When the ozone
mixing ratio reaches a few hundred ppbv (90% loss), the rate-limiting step in the ozone catalysis
sequences shifts toward the reactions of Cl and Br with O3. The concentrations of Cl and Br begin to
build. As this happens, the reaction of
Cl with CH4 shifts more chlorine from Cl into HCl. Because this occurs in October, when the
temperatures are generally high enough that no more PSCs are occurring,
chlorine is shifted from reactive forms almost exclusively into HCl. The result is an atmosphere in which HCl is
most of Cly, O3 and ClO are very low, and photolysis of
the remaining HNO3 creates NO. Chlorine chemistry effectively shuts
itself down in a matter of a week. When
the polar vortex breaks up in November or December, the ozone-poor polar air
mixes with the middle latitude air, but the chlorine is in the form of HCl, limiting further damage at
middle latitudes.
The Arctic polar
stratosphere is different from the Antarctic polar stratosphere (Brune et al.,
1991). First, it does not get as cold;
nor is the vortex as stable. As a
result, while PSCs composed of nitric acid and water form every year, those
large PSCs composed of water ice and that form below the frost point and are
large enough to settle out of the stratosphere, are rare. As a result, much of the NOy
remains in the wintertime Arctic polar stratosphere because it is not removed
by the settling of the large, ice-coated PSCs..
In addition, PSCs are less
frequent, and often occur sporadically from February until the vortex break-up
in March or April. Although the
conversion of chlorine and bromine by PSCs is as complete in the Arctic as in
the Antarctic, photolysis of the HNO3 remaining in the vortex
results in NOx production, which forms ClONO2 , as in the
following figure. Thus, the ozone loss
in the Arctic is typically about 20% at the affected altitudes, with a column
loss of about 10-15%.
Comparison of
Antarctic and Artci in situ data, taken during the Airborne Antarctic Ozone
Expedition in 1987 and the Airborne Arctic Stratospheric Expedition in 1989,
respectively. Arctic data are
represented by solid lines, Antarctic data are represented by dashed
lines. The dot-dashed line represent NOy*
mixing ratios for the Arctic, which are about 1000 pptv smaller for the
Antarctic. NOy* is
the mixing ratio of NOy predicted from the observed N2O
and the NOy-N2O relationship. All data are averaged over all flights, and
are shown with variability (±1s), except ClO in
the Arctic, which is from a flight on 10 February 1989. (from Brune et al., 1991)

Comparison of Antarctic and Artci in situ data, taken during the
Airborne Antarctic Ozone Expedition in 1987 and the Airborne Arctic
Stratospheric Expedition in 1989, respectively.
Arctic data are represented by solid lines, Antarctic data are
represented by dashed lines. The
dot-dashed line represent NOy* mixing ratios for the
Arctic, which are about 1000 pptv smaller for the Antarctic. NOy* is the mixing
ratio of NOy predicted from the observed N2O and the NOy-N2O
relationship. All data are averaged over
all flights, and are shown with variability (±1s), except ClO in
the Arctic, which is from a flight on 10 February 1989. (from Brune et al., 1991)
Because the ozone
is not completely removed before the Arctic polar vortex breaks up in February
through April, the chlorine is converted from reactive forms into ClONO2,
with conversion into HCl being much
slower than in the Antarctic. This air,
which has a higher proportion of ClONO2, will have a higher
proportion of ClO during the day due to the steady state relationship between
these two species. This difference in
the end-product of the wintertime polar chemistry may be part of the reason
that the middle latitudes in the Northern Hemisphere experience additional
wintertime ozone loss.
The onset of the
rapid loss of ozone over Antarctica is related to the increasing levels of
stratospheric chlorine and bromine driven by the increase of CFCs and
anthropogenic bromine compounds. The
increased ozone loss is consistent with the increase in CFCs and anthropogenic
bromine chemicals. As the ban on
production and use of CFCs and halons continues, the growth of the tropospheric
amounts of these compounds has almost ceased.
But the long lifetime of CFCs in the atmosphere indicates that the
Antarctic ozone hole, and some ozone loss in the Arctic, are likely to be
common features for approximately another fifty years, when stratospheric
chlorine levels decrease below 2 ppbv.
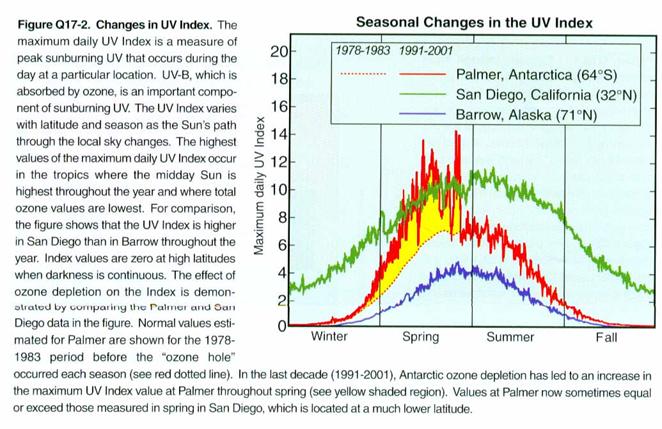
How does the UV at
Antarctica’s surface respond to the Antarctic Ozone Hole? It is greatly increased, as shown in the
figure below. We see that it becomes
roughly equivalent to the UV in San Diego.
This amount of UV is a problem for Antarctica because the ecosystem that
has evolved there is not used to so much UV.
It may be able to adapt, but it probably will need to change.
Coupling between stratospheric ozone and greenhouse
gases, and climate change.
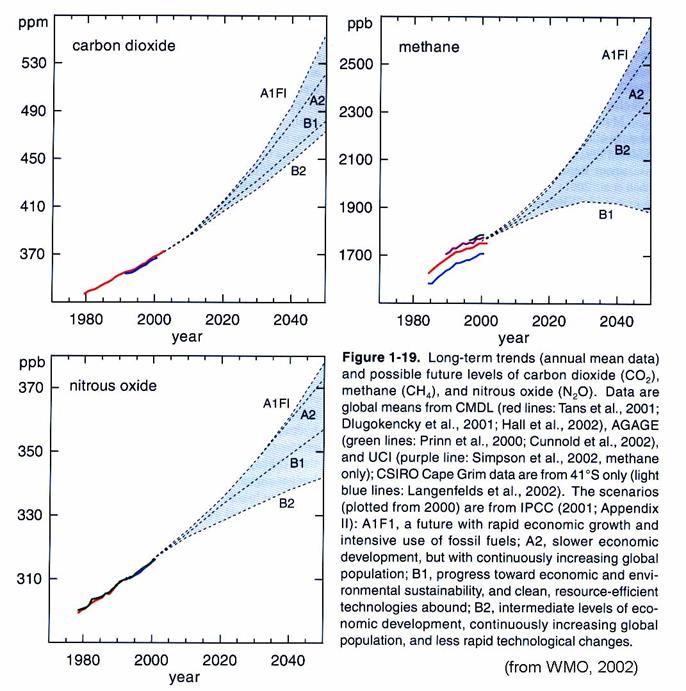
A worry is that
there is clearly coupling between the change in the atmosphere’s trace gas
composition – including CO2, CH4, and stratospheric H2O
and O3 - and stratospheric chemistry. The trends of gases that make it into the
stratosphere are shown in the figure below.
Because methane is increasing, stratospheric water vapor has been increasing
about 1%/year for the last 20 years.
However, the total cause of this trend is unclear; only ½ can be
accounted for by the increase in CH4.
At the same time,
the stratosphere’s temperature has changed in the midlatitudes and high latitudes;
the stratosphere has been getting cooler, ~0.6 K/decade in the lower
stratosphere and ~2 K/decade in the upper stratosphere, as in the figure below.
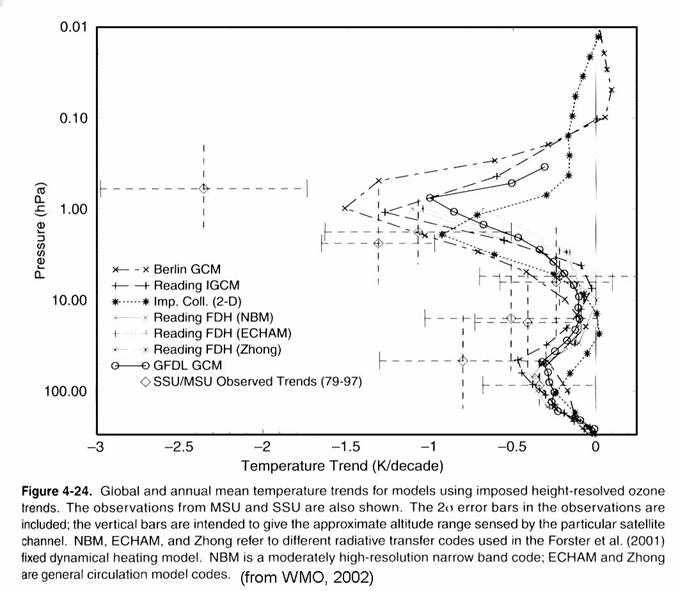
Models suggest that
this cooling has several causes. In the lower
stratosphere, stratospheric ozone decreases is more important that increases in
greenhouse gases, although increased water vapor may be playing a role. In the upper stratosphere, ozone depletion
and increases in greenhouse gases appear to be roughly equally responsible for
the observed temperature trend.
Lowering the
temperature and increasing the water vapor may make the production of PSCs more
persistent and widespread. This could
cause more ozone loss, even as the amount of chlorine in the stratosphere
decreases.
Montreal Protocol
The Montreal
Protocol was the first international treaty that addressed a global
environmental issue. The current version
of the Montreal Protocol can be found at the website: http://www.unep.org/ozone/montreal.shtml
. A brief synopsis of the Montreal
Protocol, its history and regulated substances can be found at the website: http://www.doc.mmu.ac.uk/aric/eae/Ozone_Depletion/Older/Montreal_Protocol.html
.
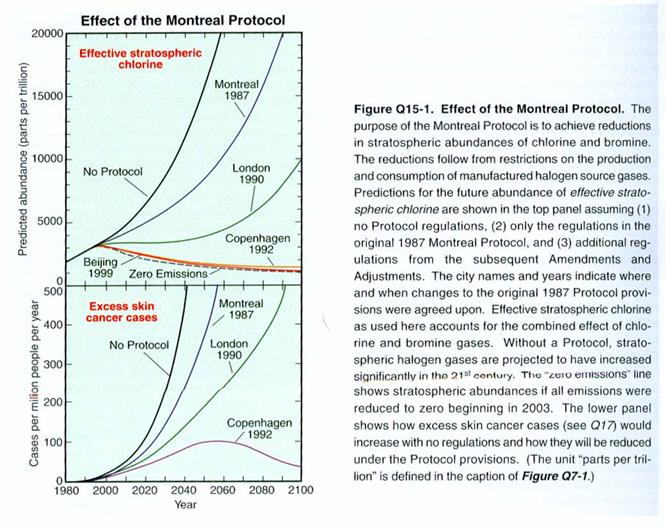
The figure below
shows the amount of chlorine and bromine that would and will be in the
stratosphere as a result of the Montreal Protocol and its updates. One of the most important features of the
Montreal Protocol is the frequent reviews of the most current science, which
are then used to bring the appropriate chemicals under regulation. For instance, when it was learned how much
more efficient bromine is at destroying ozone compared to chlorine – about 45
times more efficient per molecule – it became clear that more attention had to
be paid to chemicals such as methyl bromide, which has a large anthropogenic
source.
When viewing the
figure, keep in mind that the Antarctic Ozone Hole first appeared around 1980’s,
when the level of chlorine and bromine in the stratosphere was about 2
ppbv. If we ignore climate change, then
it is reasonable to expect that when the stratospheric levels of chlorine drop
to below 2 ppbv, the Antarctic Ozone Hole will no longer occur.
What drives the
need to maintain an ozone shield is the health of ecosystems and humans.
Summary
The dominant theme
of stratospheric chemistry is the catalytic ozone loss. Key to assessing this loss is the amount of
each chemical species in the stratosphere and the degree to which NOx
controls the reactive species from the hydrogen, chlorine, and bromine chemical
families. With the inclusion of
heterogeneous chemistry, the chemistry of the lower stratosphere below 20 km
appears to be fairly well understood from both aircraft and satellite
measurements (WMO, 1994). The chemistry
of the middle and upper stratosphere also appears to be understood, although
more observations are required.
The understanding
of stratospheric chemistry has advanced rapidly in the last twenty years. This advancement results directly from the concerted
effort of observations, models, and laboratory studies. These efforts will continue to be important
as stratospheric chemistry continues to change.
Acknowledgements.
I am grateful to J. Rodriguez and D. Weisenstein at AER,
Inc. for providing model calculations of concentrations and reactions rates of
chemical species from their well-known two-dimenstional photochemical
model.
References
Anderson,
J.G., D.W. Toohey, and W.H. Brune, 1991: Free radicals within the Antarctic
vortex: The role of CFCs in Antarctic ozone loss, Science, 251, 39-46.
Anderson,
J.G., W.H. Brune, S.A. Lloyd, D.W. Toohey, S.P. Sander, W.L. Starr, M.
Loewenstein, and J.R. Podolske, 1989: Kinetics of O3 destruction by
ClO and BrO within the Antarctic vortex: An analysis based on in situ ER-2
data, J. Geophys., Res., 94, 11480-11520.
Bates
D.R., and Nicolet, M., 1950: The photochemistry of water vapor, J. Geophys.
Res., 55, 301.
Brewer,
A.W., 1949: Evidence for a world circulation provided by the measurements of helium
and water vapor distribution in the stratosphere, Quart. J. Roy. Meteor. Soc.,
75, 351-363.
Brewer,
A.W., and A.W. Wilson, 1968: The regions of formation of formation of
atmospheric ozone, Quart. J. Roy. Meteor. Soc., 94, 249-265.
Brune,
W.H., J.G. Anderson, D.W. Toohey, D.W. Fahey, S.R. Kawa, R.L. Jones, D.S.
McKenna, and L.R. Poole, 1991: The potential for ozone depletion in the Arctic
polar stratosphere, Science, 252, 1260-1266.
Chapman,
S., 1930: A theory of upper atmospheric
ozone, Mem. Roy. Meteor. Soc., 3, 103.
Crutzen
P.J., 1970: The influence of nitrogen oxides on the atmospheric ozone content,
Quart. J. Roy. Meteor. Soc., 96, 320.
DeMore,
W.B., S.P. Sander, D.M. Golden, R.F. Hampspn, M.J. Kurylo, C.J. Howard, A.R.
Ravishankara, C.E. Kolb, M.J. Molina, 1994: Chemical Kinetics and
Photochemistry Data for Use in Stratospheric Modeling, Evaluation number 11,
JPL Publications 94-26.
Dobson,
G.M.B., 1956: Origin and distribution of polyatomic molecules in the
atmosphere,
Proc.
Roy. Soc. London, A236, 187-193.
Duetsch,
H.U., 1971: Adv. Geophys., 19, 219.
Farman,
J.C., B.G. Gardiner, and J.D. Shanklin, 1985: Large losses of total ozone in
Atnatarctica reveal seasonal ClOx/NOx interaction,
Nature, 315, 207-210.
Fahey,
D.W., S. Solomon, S.R. Kawa, M. Loewenstein, J.R. Podolske, S.E. Strahan, K.R.
Chan, 1990: A diagnostic for denitrification in the winter polar stratospheres,
Nature, 345, 698-702.
Fahey,
D.W., et al., 1993: In situ measurements constraining the role of sulfate
aerosols in mide-latitude ozone depletion, Nature, 363, 509-514.
Hampson,
J., 1965: in Les Problems Meteorologiques de la Stratosphere et de la
Mesosphere, Presses Universitaires de France, Paris, p. 393.
Hampson,
J., 1966: Technical Note 1738 (Canadian ArmamentResearch and Development
Establishment, Valcartier, Quebec, 1966).
Hanson,
D.R., and A.R. Ravishankara, 1991: The reaction probabilities of ClONO2
and N2O5 on 40 to 75 percent sulfuric acid solutions, J.
Geophys. Res., 96, 17307-17314.
Hartmann
D.L, L.E. Heidt, M. Loewenstein, J.R. Podolske, J.F. Vedder, W.L. Starr, and
S.E. Strahan, 1989: Transport into the south polar vortex in early spring, J.
Geophys. Res., 94, 16779-16795.
Hartley,
W.N., 1881: On the absorption of solar rays by atmospheric ozone, J. Chem Soc.,
39, 111.
Hering,
W.S., and T.R. Borden, 1965: Ozone sonde observations over North America, Vol.
3, Rep AFCRL-64-30(3), Air Force Cambridge Res. Labs, Bedford, MA, 1965.
Hofmann,
D.J., S.J. Oltmans, J.A. Lathrop, J.M. Harris, and H. Voemel, 1994: Record low
ozone at the South Pole in the spring of 1993, Geophys. Res. lett., 21,
421-424.
Holton,
J.R., P.E. Haynes, M.E. McIntyre, A.R. Douglass, R.B. Rood, and L. Pfister,
1995: Stratosphere-troposphere exchange, Rev. of Geophys., 33, 403-439.
Johnston
H.S., 1971: Reduction of stratospheric ozone by nitrogen oxide catalysts from
supersonic transport exhaust, Science, 173, 517.
Johnston,
H.S., and J. Podolske, 1978: Interpretations of stratospheric photochemistry,
Rev. Geophys. Space Phys., 16, 491-519.
Krueger,
A.J., 1973: The mean ozone distributions from several series of rocket
soundings to 52 km at latitudes from 58oS
to 64oN, Pure Applied Geophus, 106-108, 1271.
Leu,
M.-T., 1988: Laboratory studies of sticking coefficients and heterogeneous
reactions important in the Antarctic stratosphere, Geophys. Res. Lett., 15, 17.
Logan,
J.A., M.J. Prather, S.C. Wofsy, and M.B. McElroy, 1978: Atmospheric chemistry:
a resonse to human influence, Phil. Trans. Roy. Soc., 290, 187-234.
London,
J., 1980: Radiative energy sources and sink in the stratosphere and mesosphere.
pp703-721, in: Nicolet, M., and A.C. Aikin (eds.), Proceeding of the NATO
Advanced Study Institute on Atmospheric Ozone:
Its Variation and Human Influences, U.S. Department of Transportation,
Washington, DC, 20, 591.
McElroy,
M.B., R.J. Salawitch, S.C. Wofsy, and J.A. Logan, 1986: Reduction of Antarctic
ozone due to synergetic interactions of chlorine and bromine, Nature, 321,
759-762.
McIntyre,
M.E., and T.N. Palmer, 1983: Breaking planetary waves in the stratosphere,
Nature, 305, 593-600..
McIntyre,
1989.
McPeters,
R.D., D.F. Heath, and P.K. Bhartia (1984). Average ozone profiles for 1979 from
the NIMBUS 7 SBUV instrument, J. Geophys. Res., 89, 5199-5214.
Miller,
A.J. et al., 1994: Comparisons of the observed ozone trends in the stratosphere
though examination of Umkehr and balloon ozonesonde data, ??
Molina,
M.J., T.L. Tso, L.T. Molina, and F.C.Y. Wang, 1987: Antarctic stratospheric
chemistry of chlorine nitrate, hydrogen chloride, and ice: Release of active
chlorine, Science, 238, 1253.
Molina,
M.J., and F.S. Rowland, 1974: Stratospheric sink for chlorofluoromethanes:
chlorine atmo catalyzed destruction of ozone, Nature, 249, 810-814.
Molina,
L.T., and M.J. Molina, 1987: Production of Cl2O2 from the
self-reaction of the ClO radical, J. Phys. Chem., 91, 433-436.
Plumb,
R.A. and M.K.W. Ko, 1992: Interrelationships between mixing ratios of
long-lived stratospheric constituents, J. Geophys. Res., 97, 10145-10156.
Schauffler,
S.M., L.E. Heidt, W.H. Pollock, T.M. Gilpin, J.F. Vedder, S. Solomon, R.A.
Lueb, and E.L. Atlas, 1993: Measurements of halogenated organic compounds near
the tropical tropopause, Geophys. Res. Lett., 20, 2567-2570.
Solomon,
S., 1990: Progress towards a quantitative understanding of Antarctic ozone
depletion, Nature, 347, 347-354.
Solomon,
S., R.R. Garcia, F.S. Rowland, and D.J. Wuebbles, 1986: On the depletion of
Antarctic ozone, Nature, 321, 755-758.
Solomon,
S., R.R. Garcia, and A.R. Ravishankara, 1994: On the role of iodine in ozone
depletion, J. Geophys. Res., 99, 20491-20499.
Stolarski,
R.S., and R.J. Cicerone, 1974: Stratospheric chlorine: A possible sink for
ozone, Can. J. Chem., 52, 1610.
Stolarski,
R.S., P. Bloomfield, and R.D. McPeters, 1991: Total ozone trends deduced from
NIMBUS 7 TOMS data, Geophys. Res. Lett., 18, 1015-1018.
Tolbert,
M.A., M.J. Rossi, R. Malhotra, and D.M. Golden, 1987: Reaction of chlorine
nitrate with hydrogen chloride and water at Antarctic stratsopheric temperatures,
Science, 238, 1258.
Toon,
O.B., P. Hamill, R.P. Turco, and J. Pinto, 1986: Condensation of HNO3
and HCl in the winter polar stratosphere, Geophys. Res. Lett., 13, 1284.
US
Standard Atmosphere, 1976, 1976: U.S. Government Printing Office,
Wennberg,
P.O., et al., 1994: Removal of stratospheric O3 by radicals: In situ
measurements on OH, HO2, NO, NO2, ClO, and BrO, Science,
266, 398-404.
WMO,
Scientific Assessment of Ozone Depletion, 1994: Global Ozone Research and
Monitoring Project - Report No. 37, World Meteorological Organization, Geneva,
1995.
Wofsy,
S.C., M.B. McElroy, and Y.L. Yung, 1975: The chemistry of atmospheric bromine,
Geophys. Res. Lett., 2, 215-218.
Woodbridge,
E.L., et al., 1995: Estimates of total organic and inorganic chlorine in the
lower stratosphere from insitu and flask measurements during AASE II, J.
Geophys. Res., 100, 3057-3064.