FSC 401
INTRODUCTION TO FUEL TECHNOLOGY
This course is meant to
provide an “introduction to the scientific and engineering principles of fuel
technology.” It is a much more ‘technical’ version of EGEE 101, whose
objective is to provide an appreciation for the links between energy
consumption, environmental quality and socio-economic realities.
We shall accomplish this
objective in the following way:
(1) Show how simple mass and
energy balances, as well as thermodynamic and kinetic analyses, go a long way
toward understanding the key energy options (and dilemmas!) of modern society.
(2) Use the Internet to (i)
minimize the transfer of factual information, (ii) maximize our ability to find
the most relevant and up-to-date information, and (iii) maximize our ability to
adopt informed and critical views regarding energy and
environmental policies.
(3) Place into broad
perspective the societal impact of fuel technologies. Thus, for example,
you can easily convince yourself that the industry we are about to study
represents a very significant fraction of the U.S. economy: if the
average retail price is 20 dollars per million BTU (verify!) and the
consumption is 1017 BTU (verify!), and keeping in mind that the GDP
is some 1013 dollars (verify!), we are talking about X-dollar
industry or Y% of the GDP! (Wow!? Surprised?)
We are interested in
understanding the key concepts and knowing the important details… Everything
else that is relevant, as we shall see, can be found on the Internet, if and
when we need it (e.g., using google.com).
Here
is a sample
final exam. It summarizes the principal learning outcomes for this course.
And a recent example of an important detail is the announcement by
President Obama regarding “historic carbon pollution standards for power
plants”.
(Regarding Academic Integrity, we shall follow the
normal and sensible procedures, as described at http://www.ems.psu.edu/current_undergrad_students/academics/integrity_policy.
Grade
scale: A, >93; A-, 90-93; B+,
85-89; B, 80-84; B-, 75-79; C+, 70-74; C, 60-69; D, 50-59; F, <50.
(Borderline ‘cases’ are resolved based on extra credit assignments.)
In-lieu-of-class activity #1 (due in Angel dropbox by midnight 08/27): Find the
most updated information on the Department of Energy web site (www.eia.gov) regarding the consumption of energy
in the USA according to the various sources (coal, oil, natural gas, nuclear,
hydro, solar, etc.). Download the relevant table (*.xls) containing data as a
function of time (at least the last 30-40 years). Make a graph that clearly
illustrates the answer to the following two important questions: (a) Has the relative
contribution of natural gas increased or decreased over the past decade?
(b) Do the unconventional renewable sources (i.e., solar, wind, geothermal,
biomass) represent today more than 5% of the total energy consumption?
-If you have difficulties
navigating through the EIA web site: A-Z index -> Annual Energy Review, etc.
-Does
your graph look like this one? Be prepared to discuss it in class!
In-lieu-of-class activity #2 (due in Angel dropbox by midnight 08/31): Make a
graph of CO2 emissions in the USA as a function of time, going back
as far as the (easily accessible) statistical information allows. Has the
growth been faster or slower than that of GDP? Compare the most recent CO2
emissions of the USA with those of a few representative countries, e.g., China,
India, Japan, Germany, France, UK, Russia, Brazil, Mexico, Nigeria. Use the
following bases for comparison: tons CO2/yr, tons CO2/capita,
tons CO2/$ GDP. Which comparison do you consider to be the most
meaningful?
-Does one of your graphs look like this?
FUELS: SUPPLY,
DEMAND AND ENVIRONMENTAL IMPACT
-fossil fuels (still) represent a very large fraction of
national and global energy supply… Quantitative
details?
-unconventional renewable sources are a (very slowly?)
increasing contributor to energy supply…
-nuclear energy ‘renaissance’ depends mostly on
socio-economic issues…
-energy demand is (not?) necessarily tied to economic
development? (Relative growths in ‘developed’ vs ‘developing’ nations?)
-all energy sources produce some environmental impact… the
most severe one probably being that of fossil fuel use (SOx, NOx, COx, PM,
VOCs, …)
LAWS OF ENERGY
CONVERSION (see Ch3, book-on-the-web)
-remember Thermo 101? (E=Fd, P=E/t, …)
-BTU(ch)
vs BTU(th) vs BTU(el) vs BTU(k) vs BTU(p)…
EFFICIENCY OF
ENERGY CONVERSION (see Ch4, book-on-the-web)
-Why is conversion of heat to work so inefficient, whereas
the opposite process is very efficient?
-Energy conversion devices (E=0-100%) vs energy (heat) transfer devices
Do you agree that, if
electricity costs 10 cents per kWh(e), the cost per million BTU(th) is close to
$30? And that, if coal costs some $100/ton, its cost per million BTU(th) is
less than $10?
Homework #1 (due in Angel drop box by midnight 9/20). Here is the
evaluation summary sheet.
1. (15%) Construct a graph that
shows the relative contributions of the various renewable energy technologies
to the renewable and total energy consumption in the United States.
-Comments about this graph?
2. (15%) Develop a spreadsheet that explores the virtues
(and liabilities?) of a carbon tax (of,
say, $20/ton) by comparing the relative price increases of coal, oil and
natural gas.
3. (35%) A power plant consumes natural gas ($4.50/103
scf, 960 BTU/scf) and produces 1200 MW of electricity at an efficiency of 38%.
(a) Estimate the annual money and CO2 savings that would be achieved
if the efficiency were increased to 46%. (b) If natural gas is replaced by coal
($50/ton, 9500 BTU/lb) and the same amount of electricity is produced at 33%
efficiency, how much less (or more?) would the annual fuel cost be?
-Agree that the
answers to (a) are ca. 70 million dollars and ca. 1 million tons of CO2?
And more than 120 million dollars in annual savings for part (b)?
4. (20%) Download the appropriate Excel file(s) from the
EIA web site and make a graph of energy intensity vs time (over at least the last 40 years
or so) for several ‘representative’ countries, at least two being industrially
developed nations (including the USA) and at least two being fast-growing and
large-population less developed nations. Comment on the trends observed.
-Is one of your
graphs similar to this
one?
5. (15%) Complete in-lieu-of-class activity #2.
-Do some of your
graphs look like this?
STOICHIOMETRY OF FUEL
TECHNOLOGY
-Here is a
template for the quantitative analysis of a fossil-fuel combustion process
(e.g., in an electric power plant).
THERMODYNAMICS OF FUEL
TECHNOLOGY
-Knowledge of deltaG of a reaction is essential for
understanding fossil fuel combustion and its environmental constraints. Here is a
template for the construction of the venerable van’t Hoff plot (ln K vs. 1/T).
Does your graph look like this?
-Once we know the equilibrium constants for reactions
of interest in fuel technology, we can determine the composition of any system
of interest. Here,
following up on the class handout regarding the CO/CO2 ratio, is an
example.
KINETICS OF FUEL TECHNOLOGY
Here is a ‘code’
that allows quick analysis of first-order kinetics (see class handout entitled
“Kinetics of FF combustion (1)”). And here it is applied
to the Zeldovich mechanism of NO formation.
If
the activation energy of a reaction (that takes place at ca. 1000 K) is 200
kJ/mol, by how much does the temperature have to increase to cause a doubling
of the reaction rate? And an increase in rate by one order of magnitude? And if
the activation energy were reduced to 100 kJ/mol (by using a catalyst)? Let’s
develop a convenient spreadsheet for
this, which will allow us to explore reasonable “what-if” scenarios and thus
understand the essential difference between PCC (<1 s residence time) and
FBC (>1 min residence time).
A
beautiful example of how thermodynamics (chemical equilibrium) and (chemical)
kinetics are judiciously combined to solve a major obstacle facing continued
use of fossil fuel technologies is the Zeldovich mechanism
of NOx formation.
COAL SCIENCE AND TECHNOLOGY (Chs. 5-7, 10 and 11 in the book-on-the-web)
For a very readable recent
account of coal’s importance in the development of modern society, see Barbara
Freese’s “Coal:
A Human History.” Here is her conclusion:
“If
we do trigger drastic climate changes, all of coal’s contributions to the
empowerment of humanity will be overshadowed by the enormous price of that
power. Our excuses for continuing to burn coal while ignoring the threat of
climate change for so many years – our lack of scientific certainty, our desire
to keep our electric rates low, our fear of a slowed economy, and our
reluctance to make sacrifices others are not forced to make – will ring hollow
to those coping with the catastrophic consequences of our actions.
If,
on the other hand, we can actually make the transition to a safer energy system
before we cause more than mild climate changes, our coal use won’t be strongly
condemned by future generations. Some of our descendants may simply see coal as
a strangely primitive fuel and wonder how we tolerated it for as long as we
did. The more thoughtful among them may recognize it as an important energy
source that, for all its faults, brought us through a sort of prolonged
industrial childhood and ultimately gave us power to build a world that no
longer needed coal.”
Another relatively recent
analysis of the coal industry was provided by Jeff Goodell: “Big Coal – The
Dirty Secret behind America’s Energy Future” (Houghton-Mifflin, 2006, 324
pages). Here are a few excerpts:
“We may
not like to admit it, but our shiny white iPod economy is propped up by dirty
black rocks. This was not how things were supposed to go in America. Coal was
supposed to be the engine of the industrial revolution, not the Internet
revolution. It once powered our steamships and trains; it forged the steel that
won the wars and shaped our cars and skyscrapers and airplanes. It kept
pioneers warm on the prairie and built fortunes for robber barons such as Henry
Frick and Andrew Carnegie. Without coal, the world as we know it today would be
impossible to imagine… In the coming decades, the great danger is not that the
world will burn more coal – that’s a given – but that we will burn it badly,
cheaply, exploitatively. Instead of building modern IGCC plants that at least
allow for the possibility of sequestering the CO2 underground, we
will throw up another generation of coal burners that will pump millions of
tons of CO2 into the atmosphere and accelerate global warming…
Instead of helping developing countries leapfrog beyond coal, we will turn them
into fossil fuel addicts like ourselves. But it doesn’t have to be this way.
What can we do?
First, we must recognize that the world faces two
enormous challenges in the coming years: the end of cheap oil and the arrival
of global warming… Second, it is important to see that the barriers to change
are not technological but political… Third, we need to find ways to make the
invisible visible. I mean this in the broadest possible sense. Big Coal has
thrived largely because the costs of air pollution, miners’ safety, devastated
mountains, and global warming are invisible to us as consumers of electricity…
Old coal plants are more than just relics of an
earlier era; they are giant bulwarks against change, mechanical beasts that are
holding back a flood of ideas and innovation. When we muster up the courage to
knock them down, the revolution will begin. It’s not that I have blind faith
that technology will save us or that I think we can snap our fingers and
replace all the coal plants in the world with wind turbines and solar panels; I
simply believe that it’s within our grasp to figure out less destructive ways
to create and consume the energy we need.”
-Coal composition, C/H ratio,
S content, ash ‘content’, widely varying heating values
-Is Wyoming still a ‘booming’ state?
-PCC (C+O2), nice
example of Arrhenius-type behavior (high T
necessary)
-FBC (AFBC, PFBC), CaO + SO2
+ 0.5O2 = CaSO4 (intermediate T OK, so lower NOx as well)
-IGCC (see, for
example, http://www.tampaelectric.com/news/powerstation/polk/igcc/),
C+H2O, C+O2 (Why?)
-Coal liquefaction (makes
sense at ca. $100/bbl?), C+H2 (OK, but where will the H2 come
from?)
See National Geographic of March 2006, pp. 96-123.
-“Coal is king again. Oil supplies are tight and natural
gas prices are spiking, but coal could light our houses and power our factories
for centuries. The price of this energy abundance could be high, however… ”
-“… the giant Gibson generating station is … gulping 25
tons of coal each minute, sending thousand-degree steam blasting through
turbines that churn out more than 3,000 megawatts of electric power… pumping
enough power into the grid for three million people.”
-“The U.S. is the Saudi Arabia of coal. About 40
coal-burning power plants are now being designed or built in the U.S. China,
also rich in coal, could build several hundred by 2025.”
-“Who has coal? The world has more than a trillion tons of
readily available coal: 27% in the U.S., 17% in Russia, 13% in China, 10% in
India, 9% in Australia, 5% in South Africa…”
-“Who uses coal now? Global coal consumption is roughly
five billion tons a year, with China burning the most, 1,531 million tons,
Europe 1,117, U.S. 1,094, India 431, Russia 251…”
-“A hundred miles up the Wabash River from the Gibson plant
is a small power station that looks nothing like Gibson’s mammoth boilers and
steam turbines. This one resembles an oil refinery, all tanks and silvery
tubes. Instead of burning coal, the Wabash River plant chemically transforms it
in a process called coal gasification.”
Any more recent
popular media reports regarding the curse and/or blessing of (abundant)
coal?Have you heard of RGGI?And seen this recent Washington Post article?
Let’s review the highlights
of the most recent
EIA info and let’s construct the updated production
and consumption graphs (see Ch7, book-on-the-web).
PETROLEUM SCIENCE AND TECHNOLOGY (Chs. 8, 10 and 11 in the book-on-the-web)
For a Pulitzer prize-winning
account of petroleum’s importance in the development of modern society, and
especially in the history of the last 150 years, see Daniel Yergin’s “The Prize: The epic quest for oil, money, and
power.” And see also, hot off the press, its ‘sequel’: “The
Quest: Energy, Security, and the Remaking of the Modern World”;
it’s a must reading for all self-respecting students of fuel technologies for
the next 150 years! (How soon will we have a PBS series based on it, and will
it also obviate the need to read these 804 pages?)
For a relatively recent
analysis of the potential effect of petroleum on national (and international)
politics, as well as society’s goals, see “The Energy Mandate” column by Thomas
L. Friedman of The New York Times. For
a related analysis of a key issue – vehicle efficiency standards – by the same
author in the same newspaper, see “Et tu, Toyota!?” See also NYT of 9/21/11:
“How to weaken the power of foreign oil”… Any ‘counterbalancing’ WSJ articles
(that emphasize technological solutions, rather than the political or
ideological ones)? Can you find them
quickly using ProQuest?
Any VERY recent
media reports worth discussing (because they bring up NEW issues)?
-composition, C/H ratio, S
content, relatively constant heating value for a wide variety of products
-why need ‘refining’ before
use?
-gasoline: SIE (octane
number)
-reformulated
gasoline (Ethanol from corn or from cellulose? Deja-vu all over again?
Henry Ford’s venerable Model T was the first flex-fuel vehicle… it could run on
either ethanol or gasoline!?)
-diesel (what’s all the fuss
about VW
cheating on emissions tests?) and biodiesel
(Is McDonald’s frying oil enough?)
-jet fuel: turbines
-fuel oil #2: home furnaces
-fuel oil #6: industrial
furnaces
-petrochemistry
In the wake of BP’s Gulf oil spill,
there is much debate about the prospects for offshore drilling. Here is a relevant
graph (see also Fig. 8-10). Comments?
See also National Geographic, October
2010.
Here is an
update on U.S. petroleum imports (see Fig. 8-3 in the book-on-the-web)... Has
the trend changed more recently?
Comments?
A major recent change in the
international oil market is the increasing presence and importance of China,
which is now a major IMPORTER of oil. This is the consequence of a staggering
statistical fact (see Transportation issues below): “In
2000, 17.3 million new cars were sold in the Unitd States, compared with 1.9 in
China. By 2010 only 11.5 million were sold in the United States, while China
had reached 17 million. By 2020 sales in China could reach 30 million – and
keep going… General Motors now does sell more automobiles in China than in the
United States.” (“The Quest”, Daniel Yergin, 2011, p217).
Another, potentially
significant change is the quest for ‘unconventional’ oil sources:
-deep
sea offshore oil (e.g., Brazil)
-Arctic
(and Antarctic?) explorations (but see the very recent Shell announcement…)
-oil
(tar) sands (e.g., Athabasca, Canada)
-shale
oil (horizontal drilling and hydraulic fracturing, similar to shale gas, such
as Marcellus)… Has North Dakota replaced Wyoming as “the booming state”?
Here is an
example of the solution to Quiz #1. (Average grade=83%.)
NATURAL GAS SCIENCE AND
TECHNOLOGY (Chs. 9 and 11 in the
book-on-the-web)
For a recent analysis of the
prospects for greater reliance on natural gas in the coming decades, see Julian
Darley’s “High Noon for Natural Gas: The New
Energy Crisis.”
-composition, C/H ratio (Why the most convenient and
environmentally friendly of all fossil fuels?)
-really plentiful (for decades to come)? And
affordable? Let’s compare some hard numbers! (For an optimistic view
see, for example, C&E News of
10/3/2005. Any more recent estimates? Impact of Marcellus shale?)
-and what about LNG?
-why do electric utilities love it (for the moment)?
-how is ‘fracking’ (hydraulic
fracturing) different from, say, ‘tertiary’ oil recovery?
-does Detroit love it too?
-and what about those of us who literally can’t live
without it?
-is it possible (or sustainable?) that both coal- and
gas-derived electricity cost the same, ca. 5 cents/kWh, to produce? (See
NatGeog, 8/2005, p. 18)
For a relatively recent
analysis of LNG issues, see The Economist
of October 2, 2008 ("A more liquid market"). See also The Economist of July 12, 2012… (Can
find using google?) Let’s identify the key issues, especially the quantitative
ones! For example, can we understand how the liquefaction-transportation-regasification
cost ($200-$1000/tonne/yr) can impact the capital cost advantage that a
gas-fired power plant has over a coal-fired power plant (e.g., $0.50/W vs.
$1.00/W)?
-Anything more recent and really new on this topic?
(Exercise the use of PROQUEST database!)
And
the latest statistics of, and prospects for, shale gas? Really a “game
changer”?
Here
is the bottom line for the world; and here
for the USA. Updates? Optimistic? How to best place all this into perspective?
Do you agree that the “shale gas [has] transformed the U.S. natural gas market”
(“The Quest”, op. cit., p329)? And that “[a]s a result of the shale revolution,
North America’s natural gas base, now estimated at 3,000 trillion cubic feet,
could provide for current levels of consumption for over a hundred years—plus”
(ibid., p330)? Fate of Cove Point LNG project? And the implications of articles
such as that of Joe Nocera in the NYT of October 6, 2014 (‘‘‘Moment of Truth’”
on Emissions) and the Engelder-Howarth&Ingraffea debate in print (“Should fracking stop?”, Nature, September
15, 2011)?
Because
of recent developments, it is very important to distinguish clearly between
reserves that are ‘proven’, ‘probable’, ‘possible’, as well as ‘hypothetical’
and ‘speculative’ resources! See bottom line in Ch5 of the book-on-the-web
(Figure 5-8). For up-to-date reliable information, see www.usgs.gov.
Homework
#2 (due in Angel drop box by
midnight 10/18; #1-3 due in Angel drop box by midnight 10/6). Here is the
evaluation summary sheet.
#1 (20%):
Compare the stiochiometric requirements of the following additives for
reformulated gasoline: MeOH, EtOH, ETBE, DME and TAME. (Be sure to compare
apples and apples!) Do your oxygen contents agree with those shown in the
“energy.ca.gov” data sheet? And volume fractions? And mass fractions? Here is
a convenient (and reliable?) template.
-Search “blending
characteristics of oxygenates”? (http://www.energy.ca.gov/FR97/documents/97-10-23.pdf?)
#2 (20%): (a) A subbituminous coal
has the following elemental composition (in weight %, on dry and ash-free
basis): 76% C, 16% O, 6% H, 0.8% S, 1.2% N. It is consumed in a power plant
that produces 850 MW(e) at 34% efficiency with a 75% capacity utilization
factor. Determine the annual emissions of CO2 and SO2, as
well as the flow rate and composition of the combustion products if the process
uses 15% excess air. (b) Determine the same performance parameters for an analogous
natural-gas-fired plant and comment on the main differences.
-And a similar spreadsheet for petroleum refining products
(e.g., diesel fuel), to obtain the input parameters for #3 below?
#3 (20%):
(a) Construct convincing graphs that illustrate and summarize the temperature
and pressure dependence of the equilibrium NO/NO2 ratio. (b) Can you
easily compare these equilibrium-level NOx emissions to those mandated for
diesel-engine cars in the U.S. and Europe (0.07 vs. 0.29 g/mile?)? And does this help us to understand the central
issue surrounding the very recent VW cheating scandal?
#4 (20%):
Construct the van’t Hoff plot that illustrates the claim to fame of
fluidized-bed coal combustion: CaCO3=CaO+CO2; CaO+SO2+0.5O2=CaSO4.
Show that the feasibility window is consistent with this relatively
low-temperature (and longer-residence-time) process.
-Do your enthalpy and entropy vs. T graphs look like this?
#5 (20%):
Using basic stoichiometric and thermodynamic considerations, along with the
Zeldovich mechanism (and as many convenient but reasonable assumptions as
necessary!), determine the air pollution control requirements, in terms of
efficiency of NO removal, for a 1000-MW power plant and a 170-hp VW Jetta
engine.
-Here is (yet
another) modified Zeldovich mechanism template. (Note that when you extend this
to a system of six eqns the math gets more difficult, and you may need to use
NDSolve instead of DSolve; as an alternative, you can use the simplified
solution provided above, which reduces the system of ODEs to just one algebraic
eqn, albeit for a given fuel residence time.)
-And here is the
template for verifying the relevant equilibrium constant expressions.
-Do you agree that the typical
emissions from a power plant are 10 lb NO/t coal? (See AP-42 for “stationary
sources” or “external combustion”.) And 10 g NO/kWh from an automobile engine?
(See AP-42 for “internal combustion engines”. Is 10 g NO/kWh close to 0.87 g NO2/mile?
See the AP-42 link below and then the “Ofiice of Transportation and Air
Quality” link there…)
Exam #1.
(Average grade=80%.) Here is
an example of the solution (and evaluation summary sheet).
Here is an
example of the solution to Quiz #2. (Average grade = 76%.)
ENVIRONMENTAL EFFECTS OF FOSSIL FUEL
TECHNOLOGIES
(A brief summary… for more details, see EGEE
470!)
Air Quality
Index: Converting ‘colors’ to NUMBERS!
SOx
REMOVAL TECHNOLOGIES (see www.epa.gov)
-before
combustion: coal ‘cleaning’, coal conversion (gasification or
liquefaction); petroleum refining (HDS); gas separation
-during combustion (FBC): remember the thermodynamic
analysis of S capture?
-after combustion (FGD: absorption, adsorption, etc.)
-solubility of H2S (obtained in fuel
gasification) vs. SO2 (obtained in fuel combustion) vs. partial
pressure!?
Here the key issue is the
required efficiency of the removal device. This is obtained as follows:
-Determine the uncontrolled emissions (from the mass
balance; double-check by consulting AP-42): X
-Find out the allowed emissions for your particular case
(e.g., NSPS; not to be
confused with NAAQS): Y
-required efficiency, E = (X-Y)/X
-Screen available technologies (e.g., www.epa.gov/ttn/chief/ap42/ch01/final/c01s01.pdf,
Table 1-1-1) and eliminate those whose efficiency is lower than E
NOx
REMOVAL TECHNOLOGIES (see www.epa.gov)
-during combustion (T control, A/F ratio control)
-after combustion (adsorption, selective reduction):
SCR easy (although not particularly efficient) in power plants, and a major
challenge in diesel vehicles!
Here too the key issue is the
required efficiency of the removal device. The procedure is the same as for
SOx, except that the mass balance does not help much. (Why?) Be sure to get X from the most authoritative source
(Federal Register, e.g., Vol. 63, No. 179, 9/16/1998)!
-Zeldovich mechanism:
thermo + judiciously simplified kinetics! Here and here is the
summary.
UNBURNED HYDROCARBONS (VOC):
REMOVAL TECHNOLOGIES
-VOCs contribute to smog formation (see EGEE 470)
-‘incineration’ or “thermal oxidation” or “catalytic
oxidation” (fancy terms for combustion)
-The kinetics of the reaction is the key here… Analyze the
bottom line of the Arrhenius eqn! (See the CO/CO2 ratio analysis
below.)
-adsorption (but what then…? Easier incineration?
Recovery?)
CATALYTIC CONVERTER:
Three-way catalyst! (See, for example, http://auto.howstuffworks.com/question66.htm.)
-CO oxidized to CO2
-Unburned hydrocarbons oxidized to CO2 and H2O
-NOx reduced to N2 (See the bottom line of the
VW ‘scandal’ below…)
PM REMOVAL TECHNOLOGIES (see www.epa.gov)
-Key concepts: fluid and particle dynamics (e.g., terminal
velocity)
-Usually can be VERY efficient, and even affordable (e.g., use
of devices in series, rather than in parallel), even for small particles (PM2.5)
-Main technical challenges: soot (and NOx)
removal from diesel engines -> “catalytic filter”!?
ACID RAIN and SMOG
-SOx and NOx à H2SO4 and HNO3
-What is smoke
and what is fog? (soot particles, H2O
and other droplets)
-Beneficial vs. detrimental ozone
-Technology exists… But who is going to pay?
GREENHOUSE GASES
-The Kyoto
Protocol went into effect... (But was it effective? And is there an
enforceable sequel on the horizon?) And Al Gore and IPCC won the 2007 Nobel
Peace Prize... So, what do we do
now?
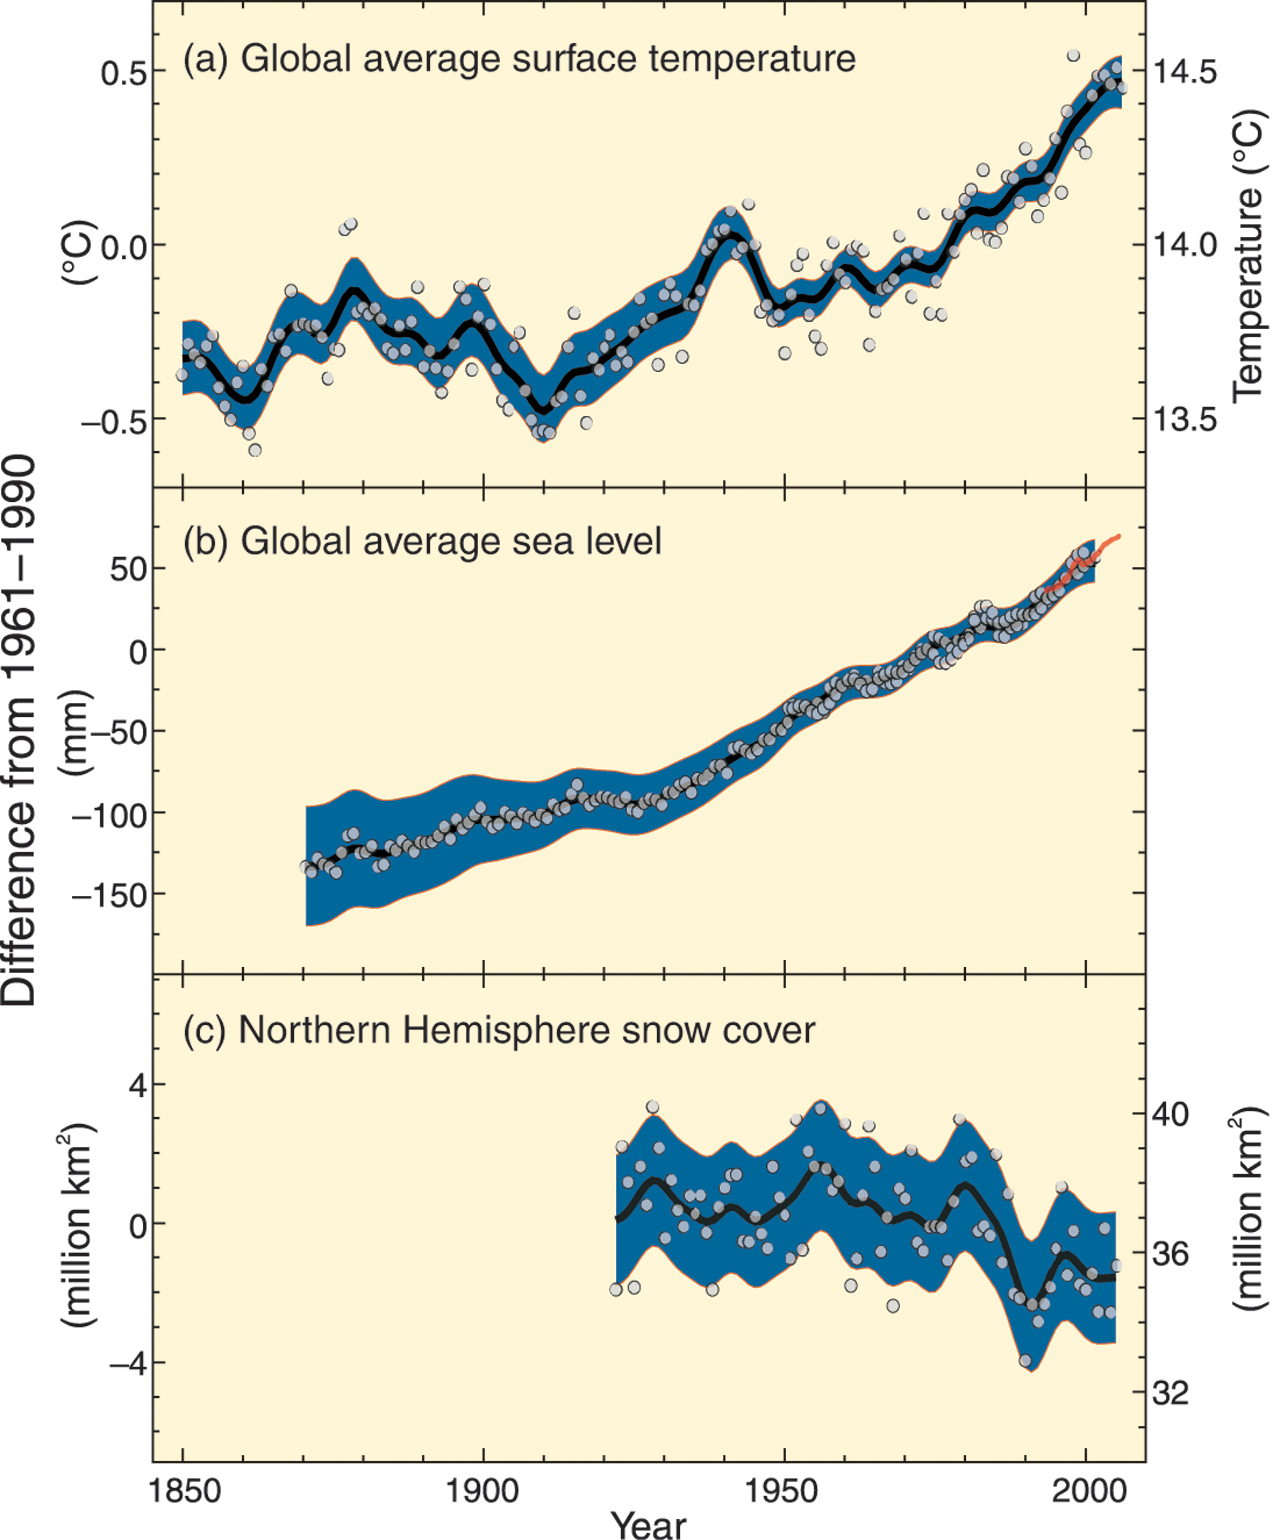
-Science just plain “makes sense”… Cause(s)? Effect(s)?
-So
it’s better to be safe than sorry!?
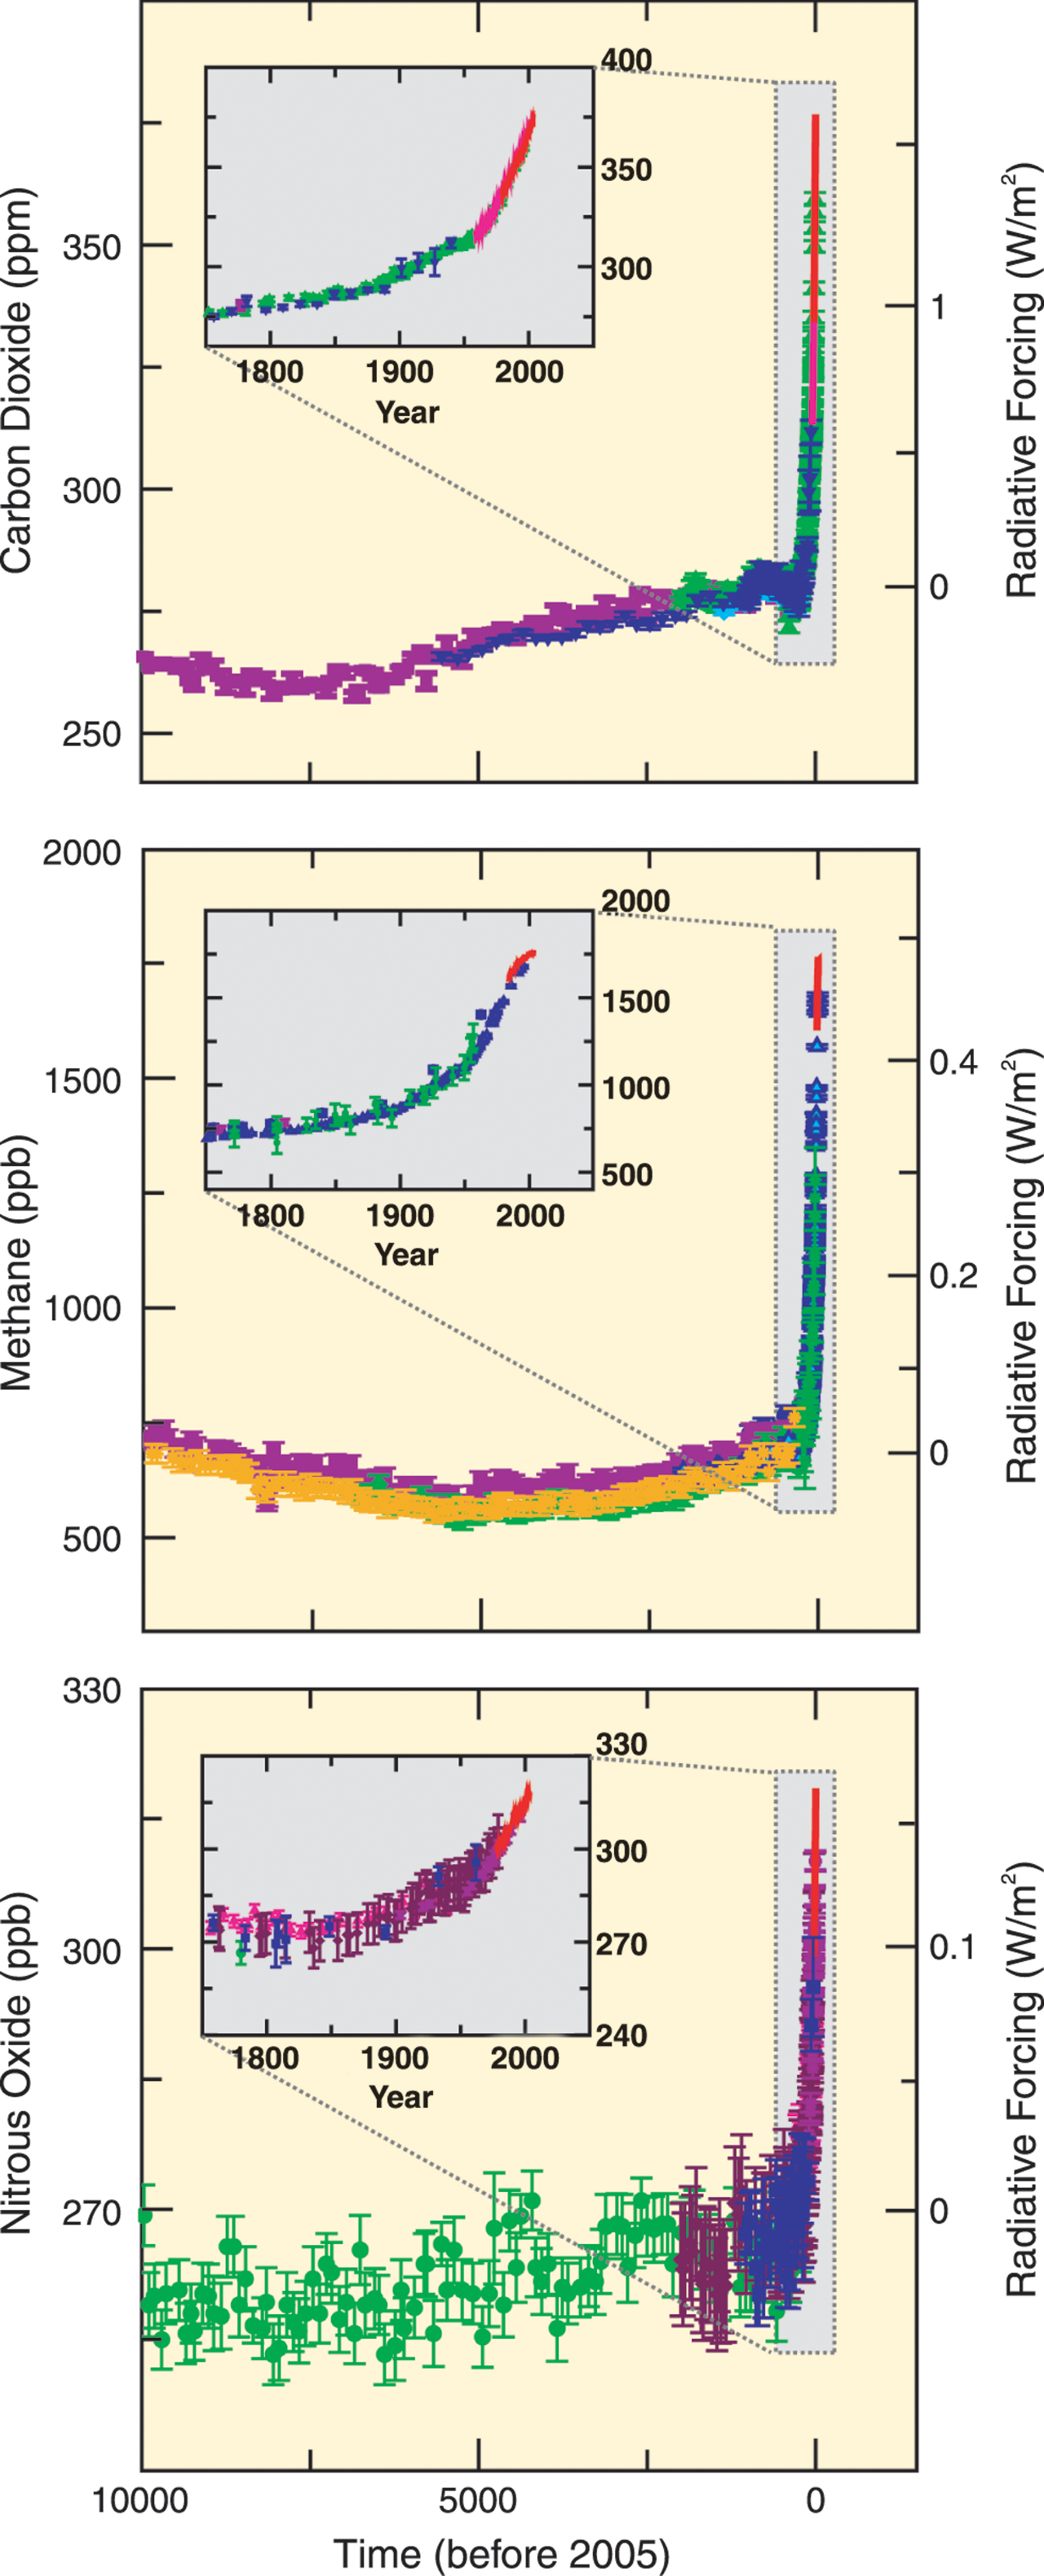
-CO2, CH4, N2O, CFCs.
-For one (feasible?), conveniently graphical proposal
toward a solution, see http://www.princeton.edu/~cmi.
Many books and essays have
been written about the imminent end of the “carbon age”. For example, Eric
Roston (“The Carbon Age: How Life’s Core Element Has Become Civilization’s
Greatest Threat”, 2008) informs and entertains, but one may question his
expertise if his basic numbers are not correct: on p168 (hard cover) he says
that “the United States emits about 120 pounds of carbon per capita into the
air daily”. Show that this number is (or is not?) correct!
And as a very timely
transition to our discussion of the (technical) challenges and opportunities
for non-fossil-fuel-based technologies, see this recent article
from a most authoritative source!
.
NUCLEAR ENERGY
For a summary of the
bottom-line issues (sufficient for our purposes), see Chs. 12-15 in the
book-on-the-web… In particular, be sure to know how to show that 1 kg of
nuclear fission fuel (e.g., U-235) can be converted to a million times more
energy than 1 kg of the ‘best’ fossil fuel. Here is a useful link.
Here is an example
of readily available information about a specific nuclear reactor (power
plant). For additional details, see www.nrc.gov.
Use the Internet to explore
the Yucca Mountain issue to see how close we are
to solving one of the three big problems associated with the (eagerly?)
anticipated “nuclear industry comeback”. (See, for example, National Geographic, April 2006: “The long
shadow of Chernobyl” & “Nuclear power
risking a comeback: it’s scary; it’s expensive; it could save the earth”.)
Which one is this? (And which ones are the other two?)
Is this the most recent
update on the Yucca mountain ‘saga’? (Why is 24,000 yrs a convenient number to
remember… and an important one to justify?)
Relevance of (the growing?) “nuclear
club”.
Summarize briefly what we
mean by nuclear ‘proliferation’ and explore the importance (and the list of
signatories) of the nuclear
non-proliferation treaty. (And what does this have to do with the future of
nuclear energy in the USA and the world?) What is IAEA?
-Is it easy to verify the statement -- broadcast on CNN
(October 23, 2011) during Fareed Zakaria’s interview with Iran’s president --
that Iran apparently now has 70 kg of 20%-enriched uranium, and that 130 kg is
the minimum (“critical mass”) for making an atomic bomb? How is that related to
the timeline that Israel’s defense minister gave to Charlie Rose (can find on
PBS?) on October 20, 2014, that Iran is about “one year away” from having an
atomic bomb.
Is Japan ready to restart
(most of) its nuclear power plants?
Extra Credit assignment:
Construct an updated
Figure 15-3 and comment on the (new? different?) trends.
RENEWABLE ENERGIES
-For
a summary of the bottom-line issues, see Chs. 16 and 17 in the book-on-the-web…
See also this up-to-date
summary from the WorldWatch Institute.
-Explore
also some of the recent media reports, e.g., August 2005 and October 2007 issue
of National Geographic… In the
latter, let’s focus on understanding (and agreeing with?) the key numbers
shown for corn ethanol, cane ethanol, biodiesel and
cellulosic ethanol. Any more recent and equally or more important
reports? (Have you seen Frontline’s “Heat”? And Nova’s “Power Surge”?) What has
T. Boone Pickens
been doing lately? And Amory Lovins?
-Comment
on fuel
ethanol statistics in the U.S. and the world? Implications for the
automobile of the future?
-The
crucial issue in biomass utilization is our ability to produce ethanol from cellulose (rather than from starchy grain, which of course
society has ‘mastered’ several millennia ago… Remember Dionysus or Bacchus?).
What is the main difference between cellulose and starch (if both polymers
consist of glucose monomer units), which makes starch (‘grain’) easily
hydrolyzable and cellulose (‘wood’) so difficult to process (by hydrolysis and
subsequent fermentation) into ethanol? Here
is a recent governmental report, and here
a bottom-line media report. Can you find a relevant podcast (e.g., Science magazine’s “Scaling up a biofuel…” of
9/5/14)?
-Anything
‘green’ is popular these days… (Mostly talk, or some action as well?) Even “green carbon” is
being tossed around!?
-In
1976 the “soft path”
made a lot of sense to a lot of people, vs. the “hard path”… Where are
we now in this regard?
-From
the more recent media reports, it seems that wind
energy has been making important progress… See, for example, “Taming
Unruly Wind Power” in the NYT of 11/04/2011. What is the maximum power of a
modern, commercially available wind turbine? How large is wind’s contribution
to the energy supply of the U.S. and the world? Is the case of Denmark a
harbinger? (See NYT of 11/10/2014, “A Tricky Transition from Fossil Fuels:
Denmark Aims for 100 Percent Renewable Energy”.)
-Here is a VERY
revealing graph… Message(s)? Are the same message(s) more obvious here?
-How
are solar energy companies doing these days? (Is Solar Trust of America an exception, or the rule?) What products
are they offering? Can we buy these at Home Depot or Lowes? Is NREL helping?
Comment regarding this solar
electricity production graph?
-Extra credit: provide an update for Figure 16-9 and comment on the
recent hydroelectricity trends in the USA. Are
you surprised, then, that a typical projection for future contribution of
renewables to electricity generation in the U.S. looks like this?
RUDIMENTARY ECONOMIC ANALYSIS OF FUEL
TECHNOLOGIES
-This
is a necessary consideration when analyzing realistic prospects of
alternative fuel technologies… Here is
a bottom-line Economics
101 refresher!
-How much does one have to drive in order to recover in 5
years the higher investment in a more efficient vehicle (e.g., 5K for 50 vs. 30 mpg)?
-“levelized cost of electricity”: is this an understandable
and reliable ‘calculator’? Useful for our ROR
analysis? Any other, better or similar, ones? (Is wikipedia’s “cost of
electricity by source” to be trusted?)
Here is an
example of the solution to Quiz #3. (Average grade=84%.)
Homework #3 (due in Angel drop box midnight Nov8). Here is the
evaluation summary sheet.
1. Select at least one link from the above summary of
environmental effects of fossil fuel utilization, analyze it and then find one
or two more recent media reports and discuss them, with special emphasis
on their quantitative aspects.
2. Select at least one link from the above summary of
nuclear energy issues, analyze it and then find one or two more recent media
reports and discuss them, with special emphasis on their quantitative
aspects.
-For an assessment of
information reliability, see, for example, the 2015 IAEA report on the status
of the Nuclear
Power Reactors in the World.
3. Select at least one link from the above summary of
renewable energy issues, analyze it and then find one or two more recent
media reports and discuss them, with special emphasis on their quantitative
aspects.
In-lieu-of-class activity for Oct27 (due in Angel drop
box midnight 10/29): As a
step toward HW3-1 completion, find reliable updates, and provide a
quantitative commentary, on the graphs posted under “Cause(s)” and “Effect(s)”
in the section above on greenhouse gases.
In-lieu-of-class activity for Oct29 (due in Angel drop
box midnight 11/02, accepted until noon 11/03): As a step toward HW3-2 completion, analyze and
comment the article “Nuclear plants dip into funds” (Centre Daily Times, October 26, 2015). In particular, does the
statement that “the site … contain[s]… 550 metric tons of spent fuel the plant
generated in its 25-year life” make sense based on reliable information
available elsewhere?
Exam #2: due in Angel drop box midnight 11/20. Here is an
example of the solution.
In-lieu-of-class activity
for 11/17: Using as your basis the
information provided in the book-on-the-web, provide an updated analysis of biomass energy in the USA by (a)
identifying and commenting on a recent media report and (b) constructing
relevant graphs which clearly answer the following questions: (i) Have the
proportions of its various contributors changed significantly over the last few
decades? (ii) Has its contribution to electricity production changed? (iii) Has
its contribution to transportation fuels increased significantly?
In-lieu-of-class-activity for
11/19: Using as your basis the information provided in the book-on-the-web,
provide an updated analysis of solar
energy in the USA by (a) identifying and commenting on a recent media
report and (b) constructing relevant graphs which clearly answer the following
questions: (i) Have the proportions of its various contributors changed
significantly over the last few decades? (ii) Has its contribution to
electricity production changed? (iii) Does it satisfy an increasing fraction of
residential and commercial energy demand?
Here is
an example of the solution to Quiz #4. (Average grade = 74%.)
Homework #4 (due in Angel drop box
midnight 12/03): Based on the results of the above activities, (i)
project the evolution of the various contributors to the energy consumption in
the USA and the world over the next 50 years, and (ii) construct the
corresponding graph of greenhouse gas emissions. (iii) Compare your graphs to
those being discussed these days in anticipation of the Paris Climate Change
Summit (COP21).
-Do your results agree with,
say, those contained in the NYT article “The Climate Change Pledges Are In.
Will They Fix Anything?” (Nov23, 2015)?
Here is an
example of the solution to Quiz #5.
Homework #5 (due in Angel drop box by midnight
12/15):
1. Complete the economics 101 spreadsheet by comparing
the profitabilities of a 350 MW(el) coal-, natural-gas- and wind-based power
plant.
-Here
is an example of the CPW vs time
graph for coal. And here
is a spreadsheet on which it is based.
2. Perform a critical analysis of the article “Climate
Interactive Ratchet Success Pathway: Assumptions and Results”, published
very recently in anticipation of the COP21 summit. In particular, (a) select
one of its important graphs, (b) discuss how reasonable its assumptions are,
and (c) comment on the implications of its results for the future of currently
important fuel technologies.
Exam #3: Tuesday, 12/15, 4:40-6:30 pm, 151 Willard. Average
grade = 74%.
Final grades have
been posted. (Class average = 75%.) Please
check that your records agree with mine, and let me know if they don’t asap.
LRR3@psu.edu (updated 12/17/2015, 20:35)