- Figure 1.8 : Isoplethed snow from
Blizzard of '93 (color version)
Figure 1.9 : Topographic map of the island of Hawaii
EXTRA : Wilkes-Barre/Scranton daily climatology
EXTRA : Distribution of high temperatures for Nov.13 (1926-94) at AVP ("normal" high is 49)
EXTRA : Distribution of low temperatures for Nov.13 (1926-94) at AVP ("normal" low is 34)
EXTRA : A drifting buoy
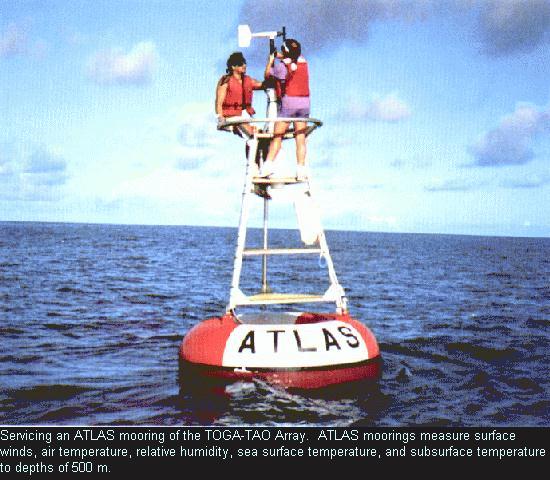
EXTRA : A moored buoy
EXTRA : USA map with state names
EXTRA : Time zones of the World
EXTRA : Locations of weather observing stations across the globe
EXTRA : World map with topography and latitude/longitude lines
EXTRA : Enhanced topographic map of United States (5 MB)
EXTRA : World map with country boundaries only
EXTRA : Isoplethed map of snowfall from Blizzard of 1996 (compare with next)
EXTRA : Colorized isoplethed map of snow from Blizzard of '96 (compare with previous)
EXTRA : Example of how one bad data point can contaminate computer-generated isoplething
Chapter 2
- Figure 2.11 : Absorptivity of
various atmospheric gases and the atmosphere as a whole
EXTRA : Latest North America visible satellite photograph
EXTRA : Latest North America infrared satellite photograph
EXTRA : Latest North America water vapor satellite image
EXTRA: Nice visible image (compare with next two)
EXTRA: Nice infrared image (compare with previous and next)
EXTRA: Nice water vapor image (compare with previous two)
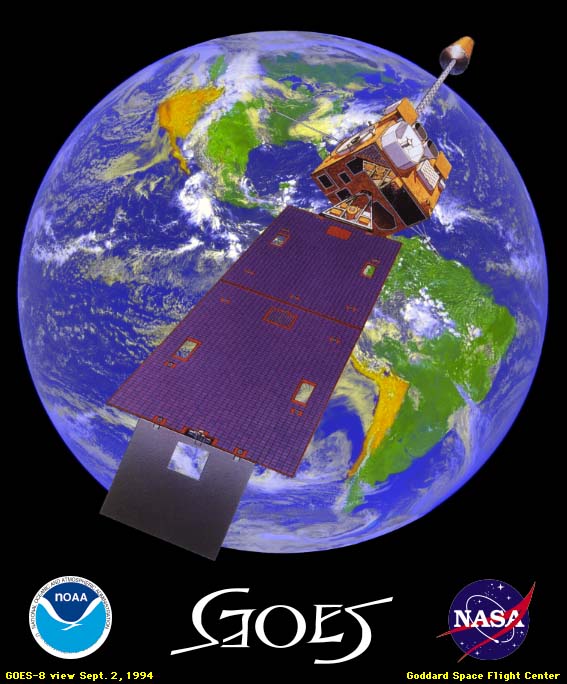
EXTRA : GOES-8 satellite
EXTRA : Locations of Doppler Radars
EXTRA : Hook echo on Doppler radar (reflectivity) - see next image for velocity
EXTRA : Hook echo on Doppler radar (velocity) - see previous image for reflectivity
Chapter 3
- Figure 3.4 : A Stevenson Screen
Chapter 4
- Figure 4.1 : The suction tube
Figure 4.2 : Toricelli's mercury barometer
Chapter 5
- EXTRA : Topographic map of Washington State
Chapter 6
- Figure 6.8a : Morning visible photo
of Great Lakes
Figure 6.8b : Mid-afternoon visible photo of Great Lakes shows low-level stability over Lakes
Figure 6.9 : Haze across Pennsylvania on visible satellite photo
Figure 6.13b : Lee waves
EXTRA cloud photographs: Cirrus , Altocumulus , Cumulus Congestus , Cumulonimubus
EXTRA : Valley Fog in Pennsylvania and New York
Chapter 7
- Figure 7.1 : Nuclear distrail
created by hot, radioactive gases from Chernobyl
Figure 7.2 : Circulation of Chernobyl radioactive particles across Europe
Figure 7.3 : Schematic showing Chernobyl radioactive particles 10 days after explosion
Figure 7.6 : Global satellite photo showing ITCZ
Figure 7.13 : Subtropical jet stream is made visible by streamer of clouds
EXTRA : Latest Goes-8 IR view of Western Hemisphere (useful to show global cloud patterns)
EXTRA : Latest Goes-9 IR view of Western Hemisphere (useful to show global cloud patterns)
EXTRA : Latest Global IR view (useful to show global cloud patterns)
EXTRA : Latest Global satellite colorized montage (useful to show global cloud patterns)
EXTRA : Latest 200-mb wind speed and direction to locate the jet stream over North America
Chapter 8
- Figure 8.2 : Continental polar air
destabilizes over Atlantic
Figure 8.6 : Lake-effect snowbands off Erie seen on satellite photo
Figure 8.7 : Snowcover from sea-effect snows in Lithuania
Figure 8.19f : Classic comma shape of occluded mid-latitude cyclone
EXTRA : Another classic comma-shaped cyclone
EXTRA : Lake-effect snowbands off Lakes Erie and Ontario as seen on Buffalo Doppler radar
EXTRA : Lake-effect snowband off Lake Erie as seen on Pittsburgh Doppler radar
EXTRA : Snow totals from extraordinary lake-effect snows of November 10-13, 1996
EXTRA : Surface stations models during extraordinary lake-effect snows of November 10-13, 1996
EXTRA : Surface streamlines during extraordinary lake-effect snows of November 10-13, 1996
EXTRA : Station models reveal sharp cold front at 3Z on 1-18-96 (also see next four images)
EXTRA : Isotherms superimposed on above analysis
EXTRA : Streamlines superimposed on above analysis
EXTRA : Isoplethed temperature change at 3Z on Jan.18, 1996
EXTRA : The front, 36 hours later, can be found using station models in the Mid-Atlantic region
Chapter 9
- Figure 9.5 : Vertical wind shear
made visible by smoke from Kuwait oil fires
Figure 9.9 : Elevated convection over the western United States
Figure 9.14 : Example of a powerful squall line
Figure 9.17 : Example of an MCC
EXTRA : Gust front and sea-breeze front visible on Doppler radar
Chapter 10
-
Figure 10.1 : Airborne dirt and dust mark
the bottommost part of a tornado
Figure 10.12 : Hook echo on a conventional radar screen
Figure 10.13a , Figure 10.13b , Figure 10.13c : Satellite photos show tornadic squall line of 5-31-85
Figure 10.14 : A wall cloud
Figure 10.15 : A funnel cloud lowers from a wall cloud
Chapter 11
- Figure 11.1 : Hurricane Florence
Figure 11.2 : Hurricane basins of formation
Figure 11.3 : Daily frequency of tropical storms and hurricanes in the Atlantic basin
Figure 11.4 : An easterly wave
Figure 11.5 : Tropical storm Iniki
Figure 11.6 : Storm track of Hurricane John
Figure 11.7 : Cross-section of a hurricane
Figure 11.8a , Figure 11.8b : Visible satellite photographs of Hurricane Gilbert
Figure 11.9 : Close-up of the eye of Hurricane Emilia
Figure 11.10 : Three-dimensional hurricane wind circulation
Figure 11.11 : Hurricane Elena
Figure 11.12 : Hurricane Emilia
Figure 11.13 : Storm track of Hurricane Gilbert
Figure 11.14a : Storm track of Hurricane Hugo
Figure 11.14b : Hurricane Hugo
Figure 11.15 : Steering of Hurricane Hugo
Figure 11.16 : Storm track of Hurricane Elena
Figure 11.17 : Steering of Hurricane Elena
Figure 11.18 : Impact of the storm surge
Figure 11.19 : Storm track of Hurricane Gordon
Figure 11.20a : Storm track of Hurricane Andrew
Figure 11.20b : Sea-level pressure and wind speeds of Hurricane Andrew
EXTRA : Outstanding selection of hurricane and tropical storm images (sat pix, some radar, few movies)
EXTRA : Satellite photograph of Hurricane Gordon
EXTRA : Trends in Atlantic tropical storms and hurricanes (1990s extrapolated from 1991-95 data)
Chapter 12
- Figure 12.17 : Squall line
associated with the Blizzard of '93
Figure 12.19 : Surface weather maps for the Blizzard of '93
Figure 12.20a , Figure 12.20b : Satellite photographs of the Blizzard of '93
EXTRA : Color wind-chill chart
Chapter 13
- Figure 13.4 : 500-mb height pattern
on July 8, 1993
Figure 13.9b : Midwest rainfall during summer of 1993
Figure 13.16 : California precipitation during January 1995
Figure 13.18 : Temperature departure from average during June 1988
Figure 13.19 : Percentage of average precipitation from April 1 to July 9, 1988
Figure 13.20b : Omega block on June 10, 1988, seen in the 500-mb height pattern
Chapter 14
- Figure 14.1a ,
Figure 14.1b : Nighttime views from space
Figure 14.2 : Soot-darkened snow surrounding Troisk, Siberia
Figure 14.5 : Biomass burning in Brazil
Figure 14.14 : Ash cloud from Mount St. Helens seen on satellite photo
Figure 14.21 : Albedo differences between forested and non-forested areas are easily visible in winter
Figure 14.24 : The urban heat island detected from space using an infrared image
EXTRA : Another example of the urban heat island detected from space using an infrared image
EXTRA : Clouds bubble over deforested Amazon land but not over the river
EXTRA : Seasonal biomass burning in India
EXTRA : The patterns of deforested land in Brazil
EXTRA : Lights of the eastern United States
EXTRA : October ozone since 1979 in the vicinity of the Antarctic
EXTRA : Average annual temperature NY Central Park 1876-1992
EXTRA: Latest ozone from space: North Pole , Global , Most Recent Ozone Hole
Chapter 15
- Figure 15.11 : Pennsylvania tornadoes by county (color
version)
EXTRA : Satellite photograph of Hurricane Agnes
EXTRA : Pennsylvania map with county names
EXTRA : Pennsylvania topography with rivers (similar to Plate 41)
EXTRA : Snowfall in Pennsylvania during the winter of 1995-96
EXTRA : New York topography with county boundaries
EXTRA : New Jersey topography with county boundaries
Chapter 16
- Figure 16.1 : Florida map with
principal geographic features and observing sites
Figure 16.10 : Large-scale view of sea-breeze fronts forming thunderstorms along both coasts

COLOR PLATES from A World of Weather
-
Plate 3 : Clematis plant shows
evidence of low-level cold air
Plate 4 : Gulf stream visible from space via infrared sensing of sea surface temperatures
Plate 9 : Smoke fanning horizontally downwind of Kuwait oil fires in April 1991
Plate 11 : Showers and thunderstorms over the mountains of Oahu
Plate 13 : Cloud-to-ground lightning stroke
Plate 15 : Mammatus clouds
Plate 16 : Dust storm produced by a gust front
Plate 17 : A pair of supercell thunderstorms
Plate 18 : Results of flash flooding over Mexico, as seen from the space shuttle
Plate 19 : Coffeyville, KS, hailstone
Plate 23 : Tornadic thunderstorms on conventional radar (compare to Plate 24)
Plate 24 : Tornadic thunderstorms on Doppler radar (compare to Plate 23)
Plate 26 : A boat carried inland by Andrew's storm surge
Plate 27 : Color-enhanced infrared satellite image of Andrew
Plate 28 : Pine trees bent by Andrew's winds
Plate 29 : Radar image as Andrew made landfall
Plate 30 : Power of Andrew's winds
Plate 31 : PDSI as of March 27, 1993
Plate 32 : Major and record flooding along the river systems of the Midwest during the summer of 1993
Plate 34 : A leaf on a pond
Plate 36 : The ozone hole in October 1994
Plate 37 : Haze over the Amazon
Plate 38 : Deforestation in the Amazon River basin
Plate 39 : Convective clouds bubble over Florida
Plate 40 : Small-scale view of thunderstorms along the southeast coast sea-breeze front
Plate 41 : Pennsylvania topography with county boundaries