Chapter 12
THE "JANUARY THAW"
Goals: To investigate whether or not the climate record for selected locations indicates a "January thaw."

| Chapter 12THE "JANUARY THAW"Goals: To investigate whether or not the climate record for selected locations indicates a "January thaw." |
Data:
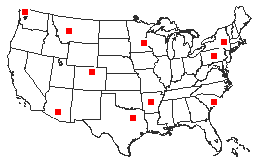
Daily maximum temperatures for the period January 5 to February 5 (which includes the time commonly referred to as the "January Thaw") for the locations listed below. Data is given for the period 1901-1990 (except for Tucson, where the data is for the period 1901-1986):
|
|
 |
Procedure:
Chapter 1 | Chapter 2 | Chapter 3 | Chapter 8 | Chapter 9| Chapter 10 | Chapter 11 | Chapter 14